How to create a Pie chart in PHP and retrieve data from MySQL
Before we begin, it is important to understand what a pie chart is.
What is a Pie chart?
A Pie chart is a circular chart divided in sectors. Each sector denotes a relative size of each value. The easiest way to generate a Pie chart is through Dashboard Builder which does not require any programming skills. The following is a step-by-step method on producing PHP code for a Pie chart.
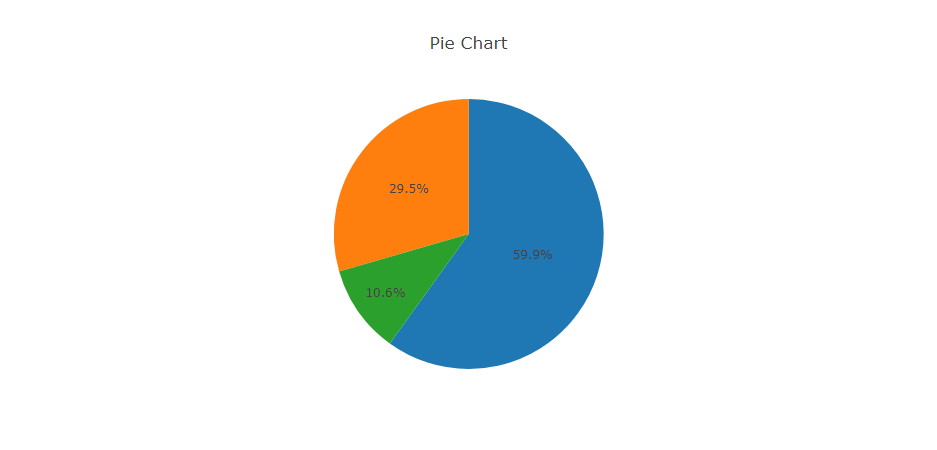
Pie Chart Tutorial
In this article, we'll use the Dashboard Builder Tool to create a Pie chart and retrieve data from a MySQL database, as well as generate PHP source code.
Requirements
- PHP Version 7.2 or later
- Apache 2 or later
- Windows 7 or later /Linux 3 or later
- Firefox 52, Chrome 57, IE 8
Installation
- Download from Download Dashboard Builder
- Place the file in a directory on the web server. e.g.
…/www/dashboar/dbuilder/ - Unzip
 the file using Extract Here option to the root folder of "dashboardbuilder"
Create your first PHP Pie Chart
- Access the web folder in your browser. e.g. http://localhost/dashboardbuilder following welcome screen will appear
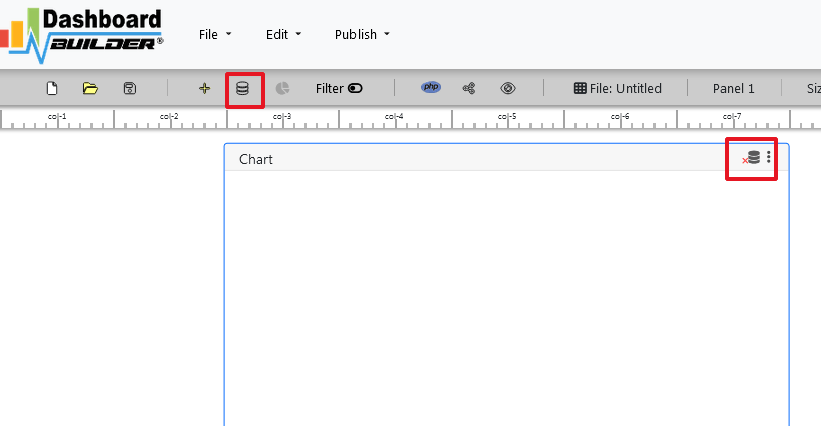
- Now Click the Database icon
- Following screen will appear. Select Database from data source tab. Select MySQL from the list of Database, Enter your
"Northwind.db"in the DB name field and Save changes as mentioned in the screen.
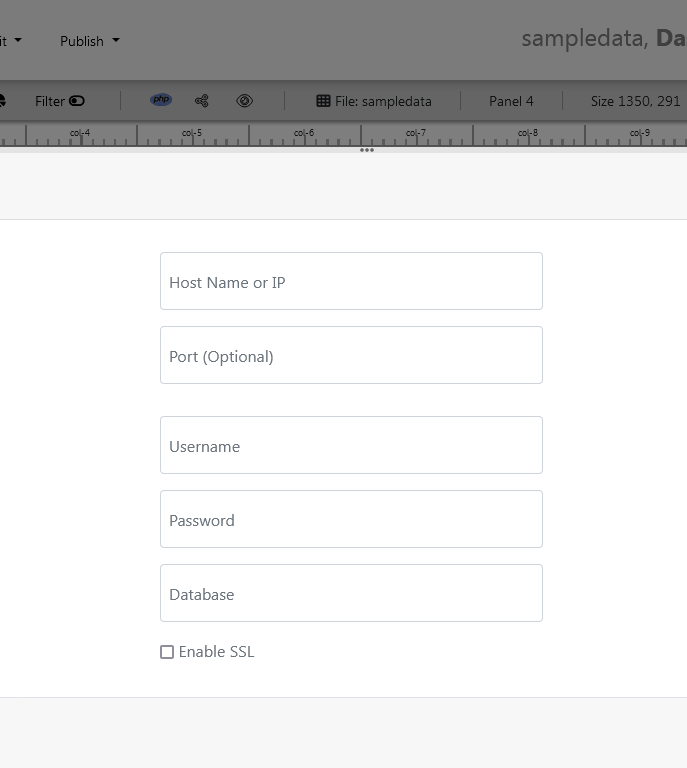
- Enter user name and password of your database.
- A green tick mark with Database will appear when your database is successfully connected.
- Select the gear icon for your Dashboard preference.
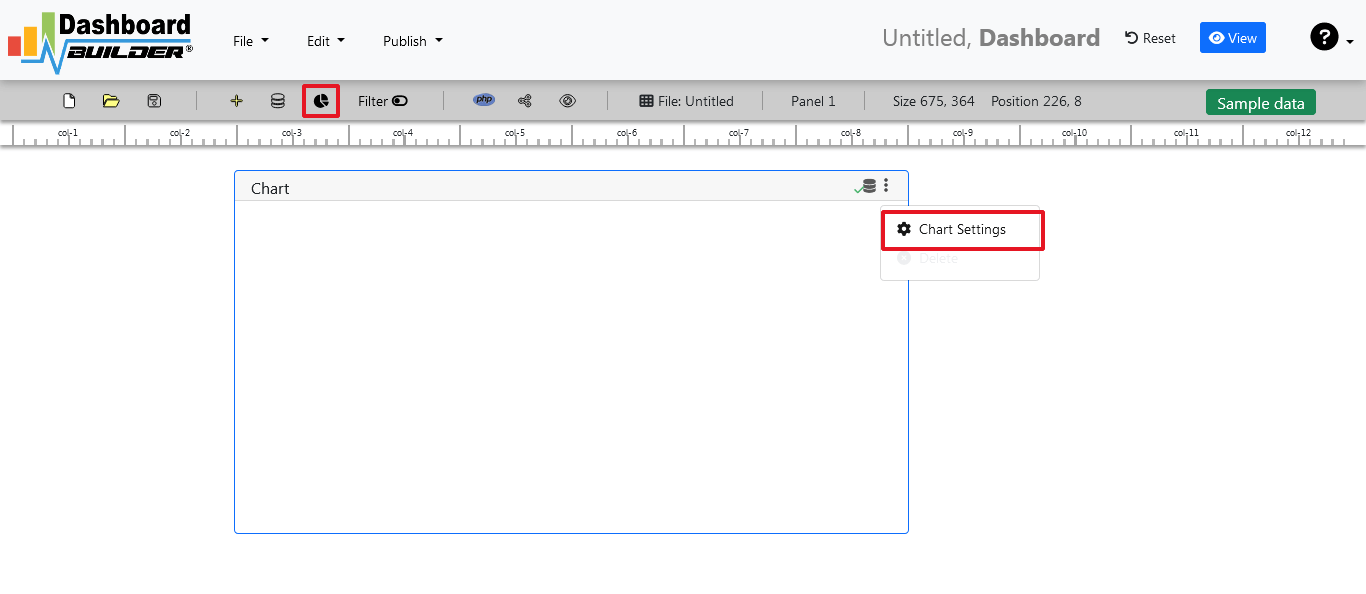
- The following screen with a list of tables will appear.

- Enter your SQL statement in text box,
SELECT strftime('%Y-%m',o.shippeddate) as xaxis, sum(d.quantity) as yaxis from `order details` d, orders o where o.orderid = d.orderid group by strftime('%Y-%m',o.orderdate) limit 50
- Click the Run Query button
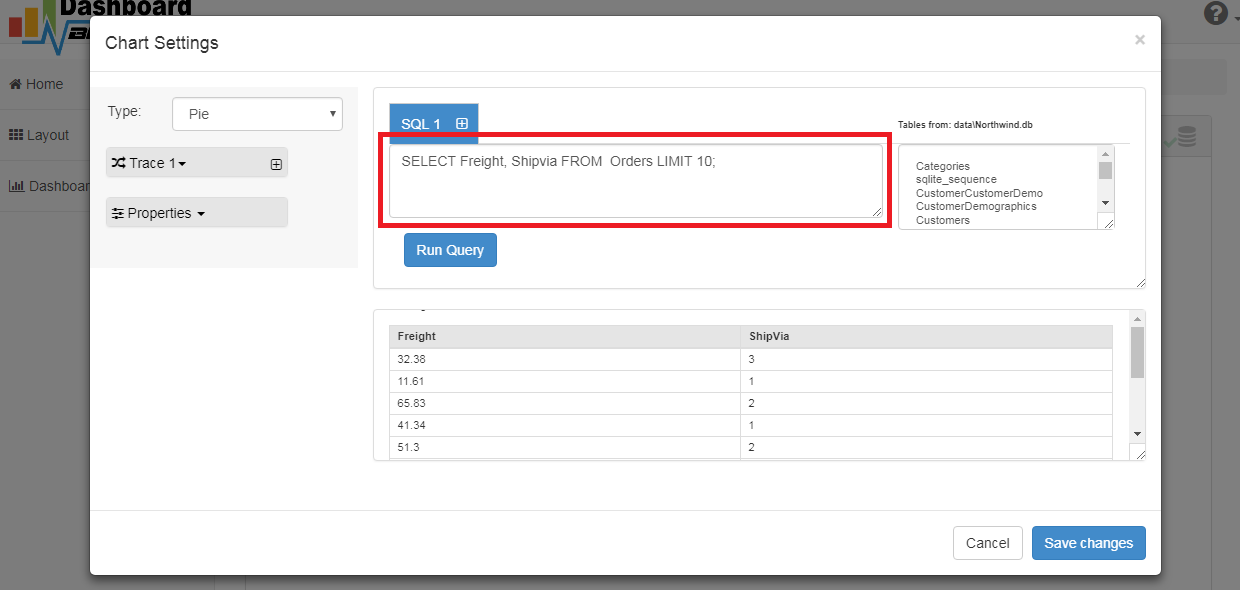
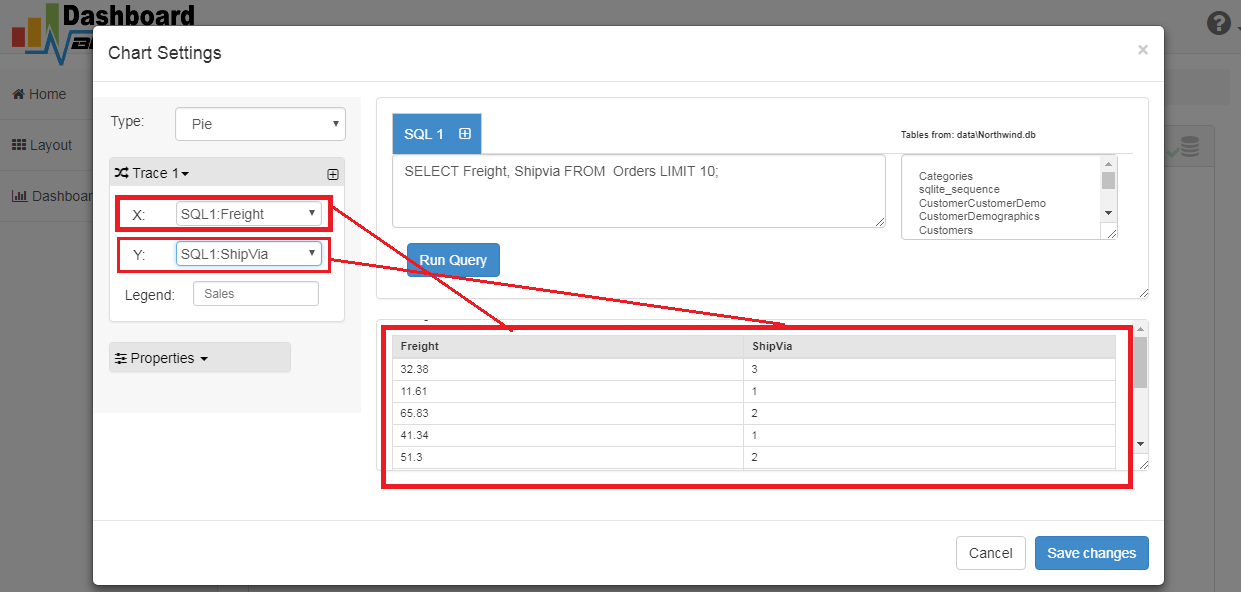
- Query Result will appear. Now Select your x-axis data from the drop down list of X and y-axis data from the drop down list of Y .
- Select Pie from the drop down list of Chart Type
- Click Save Changes
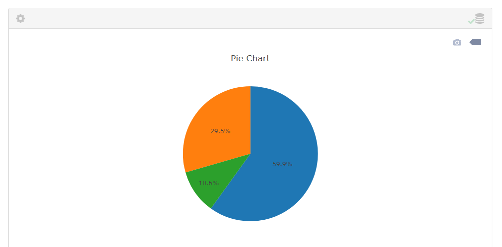
- Charts will be shown on the screen as below.
- Now extend the Generate button and click on the Pie chart PHP Source Code

- The chart's PHP code will be created automatically, and you may copy and paste it into your PHP application.
Pie Chart PHP source code
/**
* DashboardBuilder
*
* @author Diginix Technologies www.diginixtech.com
* Support - http://www.dashboardbuilder.net
* @copyright (C) 2018 Dashboardbuilder.net
* @version 2.1.7
* @license: license.txt
*/
include("inc/dashboard_dist.php"); // copy this file to inc folder
// for chart #1
$data = new dashboardbuilder();
$data->type = "pie";
$data->source = "Database";
$data->rdbms = "mysql";
$data->servername = "";
$data->username = "";
$data->password = "";
$data->dbname = "northwind";
$data->xaxisSQL[0]= "SELECT strftime(^%Y-%m^,o.shippeddate) as xaxis, sum(d.quantity) as yaxis from `order details` d, orders o where o.orderid = d.orderid group by strftime(^%Y-%m^,o.orderdate) limit 50";
$data->xaxisCol[0]= "xaxis";
$data->yaxisSQL[0]= "SELECT strftime(^%Y-%m^,o.shippeddate) as xaxis, sum(d.quantity) as yaxis from `order details` d, orders o where o.orderid = d.orderid group by strftime(^%Y-%m^,o.orderdate) limit 50";
$data->yaxisCol[0]= "yaxis";
$data->name = "piechart";
$data->title = "Pie Chart";
$data->orientation = "";
$data->xaxistitle = "x-axis title";
$data->yaxistitle = "y-axis title";
$result[0] = $data->result();
?>
<!DOCTYPE html>
<html>
<head>
<script src="assets/js/dashboard.min.js"></script> <!-- copy this file to assets/js folder -->
<!--<link rel="stylesheet" href="assets/css/bootstrap.min.css"> Bootstrap CSS file, change the path accordingly -->
</head>
<body>
<div class="container">
<div class="col-lg-12">
<div class="panel panel-default">
<div class="panel-heading"></div>
<div class="panel-body">
<?php echo $result[0];?>
</div>
</div>
</div>
</div>
</body>
 the file using Extract Here option to the root folder of "dashboardbuilder"