WordPress Chart overview
WordPress chart by Dashboard Builder is a data visualization plugin for WordPress that offers all major charts and graphs templates, which enables you to retrives your own data from WordPress or any MySQL database to display charts and graphs on your WordPress website.

Descriptions: What is WordPress Chart plugin?
Dashboard Builder has produced is a unique and powerful plugin for WordPress to present data fetches from the WordPress database using data visualization techniques that display responsive and dynamic charts using the D3.js library in a graphical layout with the most relevant information, understandable at a glance.
Features:
- No Programming Skills Required: It is easy to install and configure.
- Easy way of setting: Just set a) Database connectivity b) Write SQL Query c) Define X-axis and Y-axis
- Fully D3.js Responsive & Dynamic Chart
- Ability to connect any MySQL database even outside of WordPress
- Supports variety of charts type such as Area, Bar, Line and scatter charts
- Supports customized color
Requirements:
- WordPress Version: 4.6 or higher
- Tested up to: 5.6.2
- PHP Version: 7.2 or higher
How to install and Wordpress plugin
This document is all about how to install and configure WordPress plugin for creating a charts and graph using the Dashboard Builder
Installation of WordPress plugin for charts and graph with ease
- Upload the plugin files to the /wp-content/plugins/dashboardbuilder directory, or install the plugin through the WordPress plugins screen directly.
- Activate the plugin through the ‘Plugins’ screen in WordPress
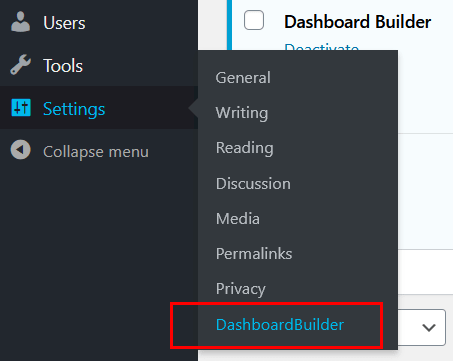
- Use the Settings->DASHBOARDBUILDER screen to configure the plugin
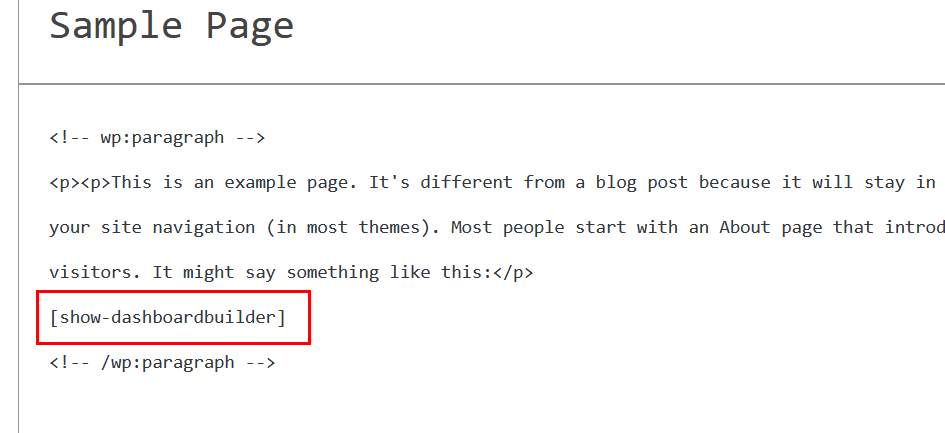
- Use short code i.e [show-dashboardbuilder] in your WP page, OR call the function
dashboardbuilderShowText()in your template's default.php file


