Performance metrics dashboard - the one and only dashboard you'll ever require to keep track of your business performance!
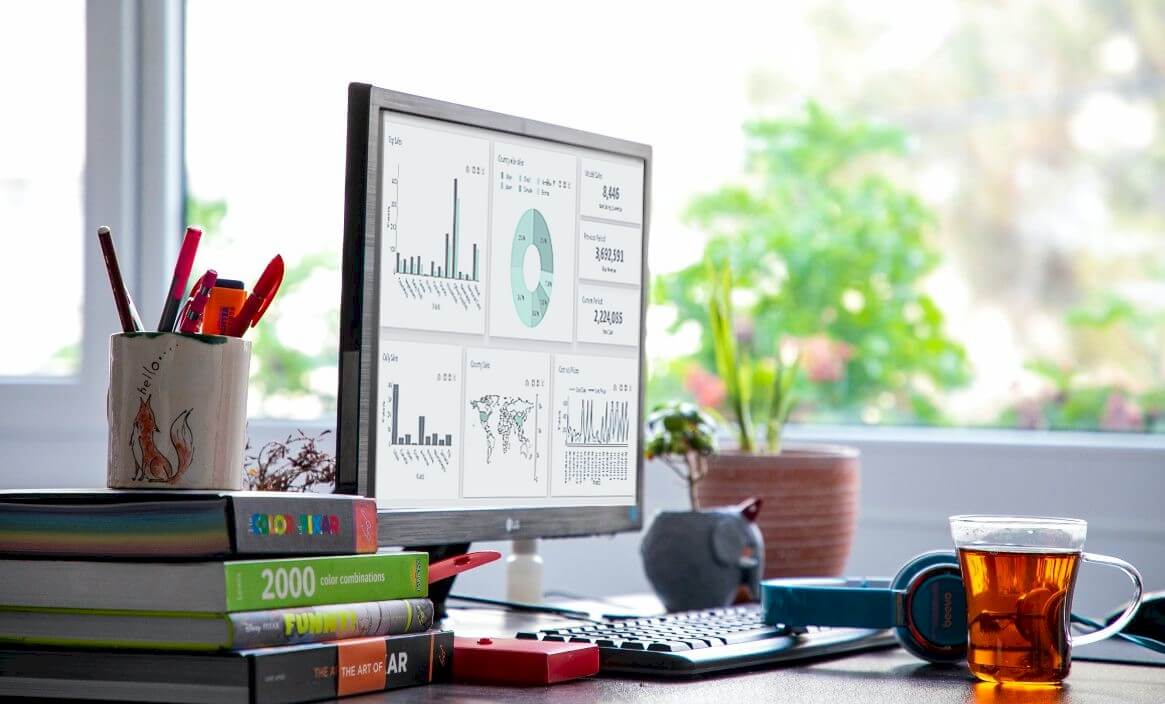
The performance metrics dashboard is a digital display of collected data. Charts, graphs, tables, and percentages may be included in these displays to help you better understand a specific area of your organization. Metrics performance dashboard tool is a piece of software or a web application that collects data from various sources and transforms it into visual forms. For example, suppose you have a list of customer ages, and your dashboard tool generates a pie graph showing the percentage of customers in various age groups.
Performance metrics Dashboard Overview
A performance Metrics dashboard allows you and your team to monitor the efficacy of various metrics, campaigns, and processes. As a result, you can improve your plans and act on data in real time. These performance metrics are essential for analyzing and evaluating a company's sales, human resources, marketing, and operational activities.
The performance metrics dashboard is the only application that can be designed to filter out unwanted information in order to keep your performances at the forefront of your mind and relevant to your intended audience. A Dashboard application's performance metrics is compelling. It can be used to connect to multiple data sources and provide users with visibility by presenting information in a timely, meaningful, and actionable format. Users can also search, drill down, and even update the presented information, saving time, streamlining workflow, maintaining record accuracy, and focusing user actions on the positive outcome of key metrics.
What is a performance metrics dashboard used for?
Performance metrics dashboards are used to assess a company's behavior, activities, and performance. This should take the form of data that measures required data within a range, allowing for the formation of a foundation to support the achievement of overall business goals. Measuring performance with metrics is critical for determining how well business objects are performing and whether targets are being met.
Is Performance metrics Dashboard FREE?
To unlock the value of your data and inspire better business decisions, use performance metrics dashboards and engaging reports. It's easy and free.
Benefits of using a performance metrics dashboards
The key advantage of utilizing a performance metrics dashboard is that it enables you to track the effectiveness of various plans, campaigns, and procedures, enabling you to modify your strategies promptly.
A simple performance metrics dashboard example
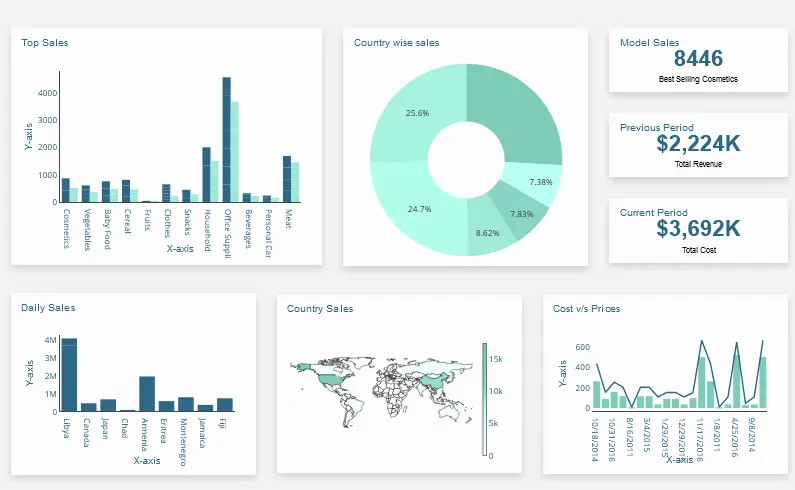
You can quickly monitor your most crucial business performance metrics on one page by connecting your data sources to this business performance metrics dashboard. You won't need to switch between platforms because everything, including conversion rates and the amount of new clients, will be visible at a glance.
How to create a performance metrics dashboard
Learn how to visualize performance metrics with this great data visualization tool and generate source code
APPLIES TO: On-premises Online Desktop
In this article, we'll use the Dashboard Builder Tool to retrieve data from a MySQL database and create a performance metrics dashboard, as well as generate source code.
Requirements
- PHP Version 7.2 or later
- Apache 2 or later
- Windows 7 or later /Linux 3 or later
- Firefox 52, Chrome 57, IE 8
Installation
- Download from Download Dashboard Builder
- Place the file in a directory on the web server. e.g.
…/www/dashboar/dbuilder/ - Unzip
 the file using Extract Here option to the root folder of "dashboardbuilder"
STEP-1: Launch the Data Visualization tool
- Access the web folder in your browser. e.g. http://localhost/dashboardbuilder following welcome screen will appear
STEP-2: Access the data
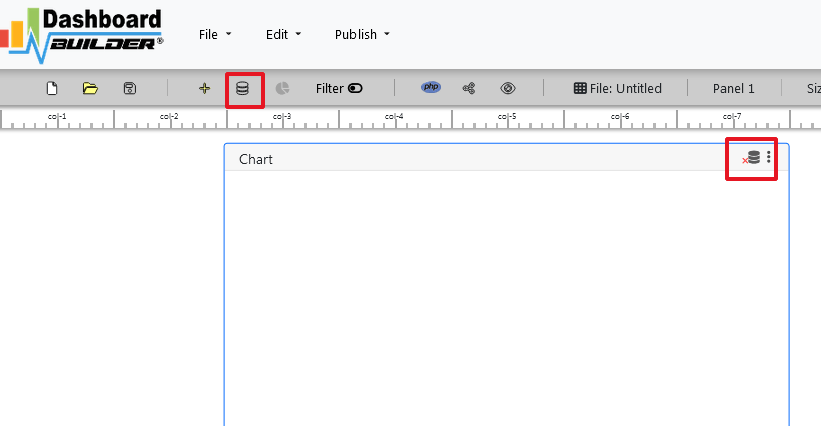
- Now Click the Database icon
- Following screen will appear. Select Database from data source tab. Select MySQL from the list of Database, Enter your
"Northwind.db"in the DB name field and Save changes as mentioned in the screen.
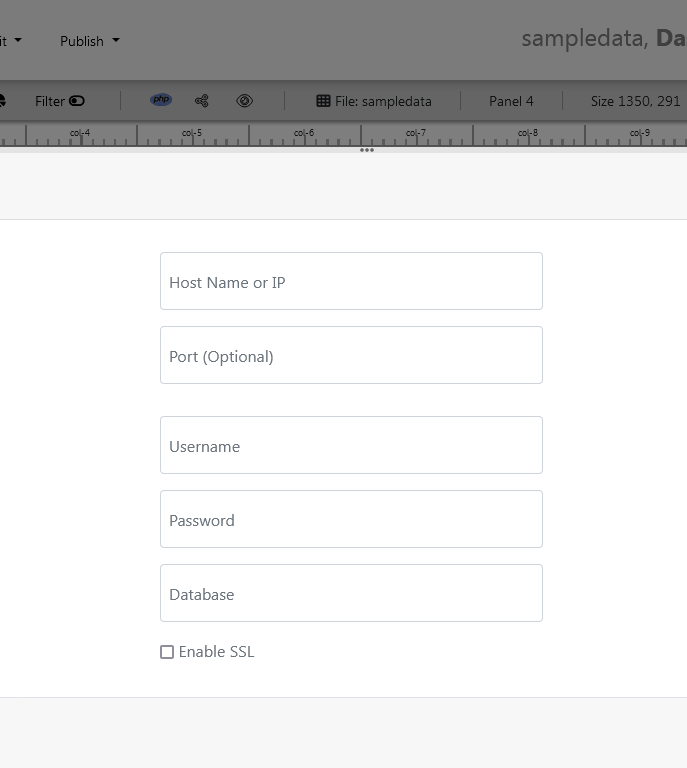
- Enter user name and password of your database.
- A green tick mark with Database will appear when your database is successfully connected.
STEP-3: Assign data
- Select the gear icon for your Dashboard preference.
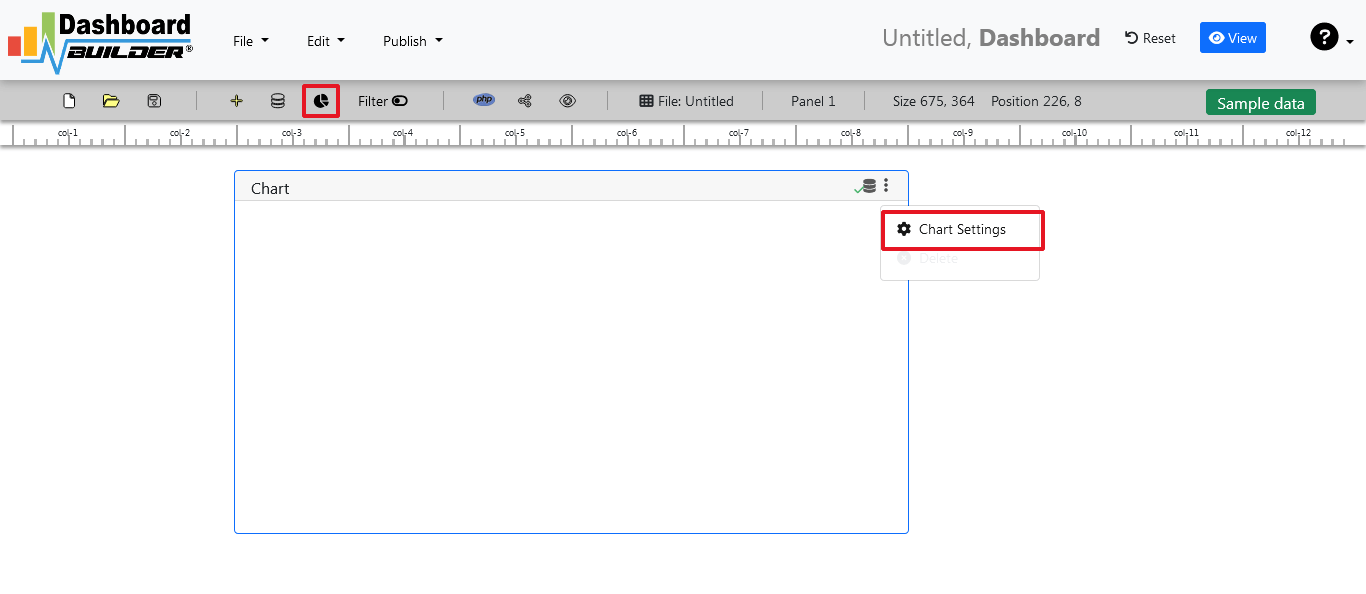
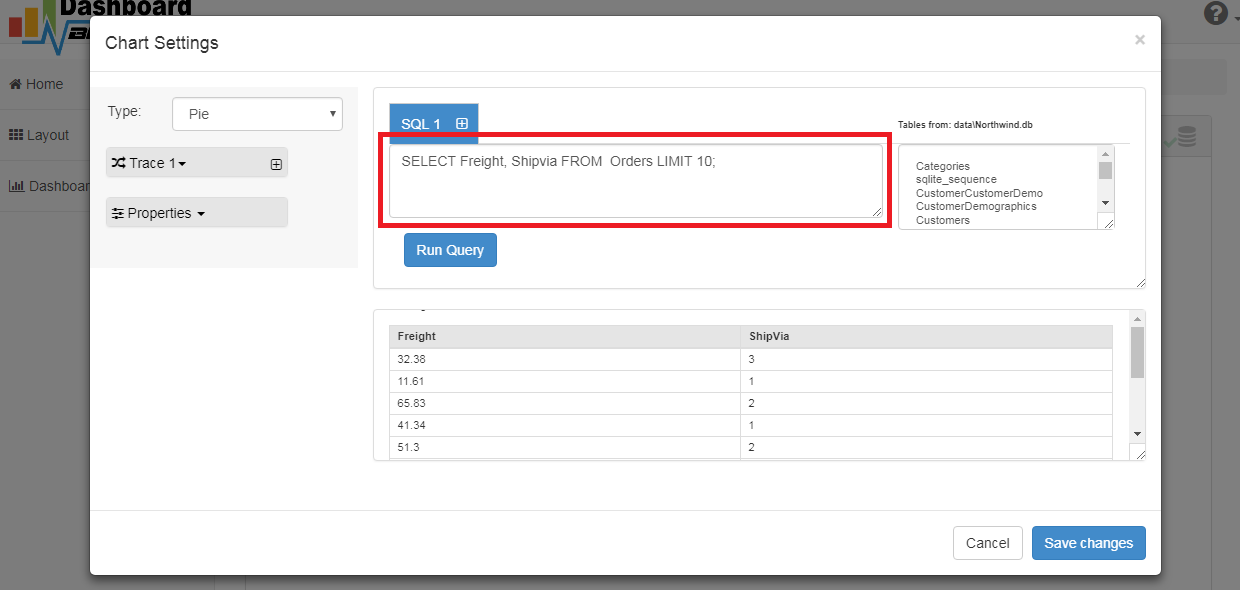
- The following screen with a list of tables will appear.

- Enter your SQL statement in text box,
SELECT strftime('%Y-%m',o.shippeddate) as xaxis, sum(d.quantity) as yaxis from `order details` d, orders o where o.orderid = d.orderid group by strftime('%Y-%m',o.orderdate) limit 50
- Click the Run Query button
STEP-4: Select the row and column
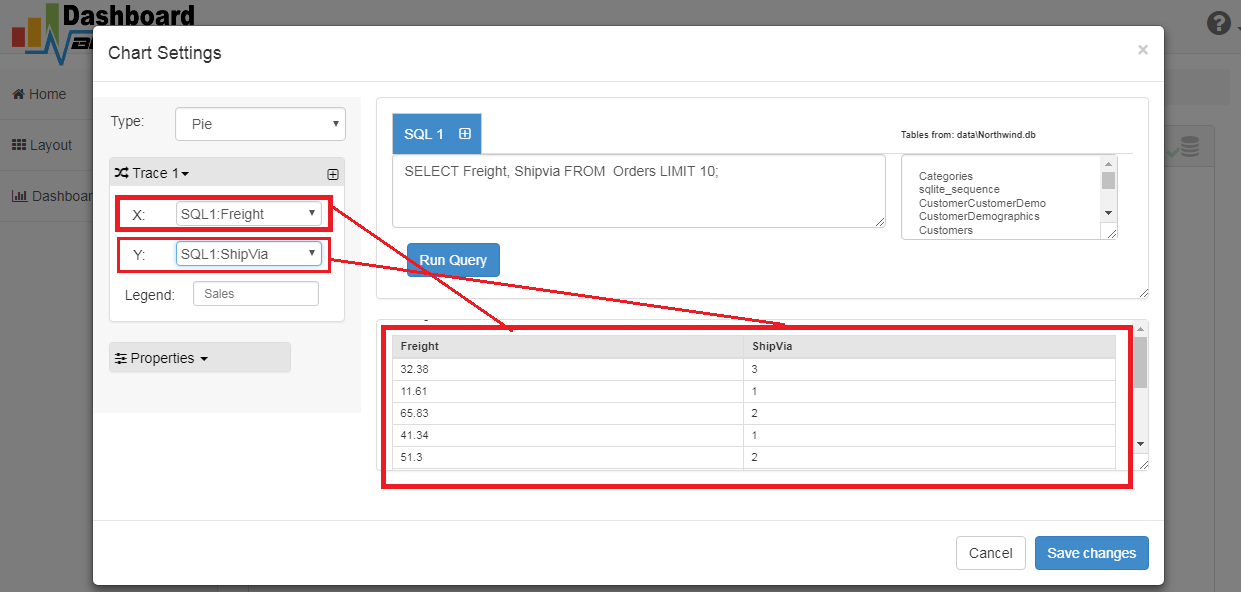
- Query Result will appear. Now Select your x-axis data from the drop down list of X and y-axis data from the drop down list of Y .
- Select Pie from the drop down list of Chart Type
- Click Save Changes
- Charts will be shown on the screen as below.
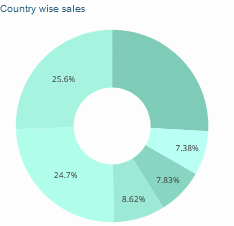
STEP-5: Generate the source code
- Now extend the Generate button and click on the Create PHP Code

- The chart's code will be created automatically, and you may copy and paste it into your PHP application.
Performance metrics dashboard's source code
/**
* DashboardBuilder
*
* @author Diginix Technologies www.diginixtech.com
* Support - http://www.dashboardbuilder.net
* @copyright (C) 2018 Dashboardbuilder.net
* @version 2.1.7
* @license: license.txt
*/
include("inc/dashboard_dist.php"); // copy this file to inc folder
// for chart #1
$data = new dashboardbuilder();
$data->type = "pie";
$data->source = "Database";
$data->rdbms = "mysql";
$data->servername = "";
$data->username = "";
$data->password = "";
$data->dbname = "northwind";
$data->xaxisSQL[0]= "SELECT strftime(^%Y-%m^,o.shippeddate) as xaxis, sum(d.quantity) as yaxis from `order details` d, orders o where o.orderid = d.orderid group by strftime(^%Y-%m^,o.orderdate) limit 50";
$data->xaxisCol[0]= "xaxis";
$data->yaxisSQL[0]= "SELECT strftime(^%Y-%m^,o.shippeddate) as xaxis, sum(d.quantity) as yaxis from `order details` d, orders o where o.orderid = d.orderid group by strftime(^%Y-%m^,o.orderdate) limit 50";
$data->yaxisCol[0]= "yaxis";
$data->name = "piechart";
$data->title = "Pie Chart";
$data->orientation = "";
$data->xaxistitle = "x-axis title";
$data->yaxistitle = "y-axis title";
$result[0] = $data->result();
?>
<!DOCTYPE html>
<html>
<head>
<script src="assets/js/dashboard.min.js"></script> <!-- copy this file to assets/js folder -->
<!--<link rel="stylesheet" href="assets/css/bootstrap.min.css"> Bootstrap CSS file, change the path accordingly -->
</head>
<body>
<div class="container">
<div class="col-lg-12">
<div class="panel panel-default">
<div class="panel-heading"></div>
<div class="panel-body">
<?php echo $result[0];?>
</div>
</div>
</div>
</div>
</body>
Sample Performance metrics dashboard
Whether you're looking for inspiration or just want to take a quick look at your clients, a pre-made sample page can get your project started. Visualizing data and graphs in web applications has never been easier.
Conclusion
You've learned how to create a performance metrics dashboard with no code application, , and customize it's look and feel using the dashboard builder. Before we go, we'd like to introduce you to the premium version of Dashboard Builder, which has many features compared to the free version.
 the file using Extract Here option to the root folder of "dashboardbuilder"