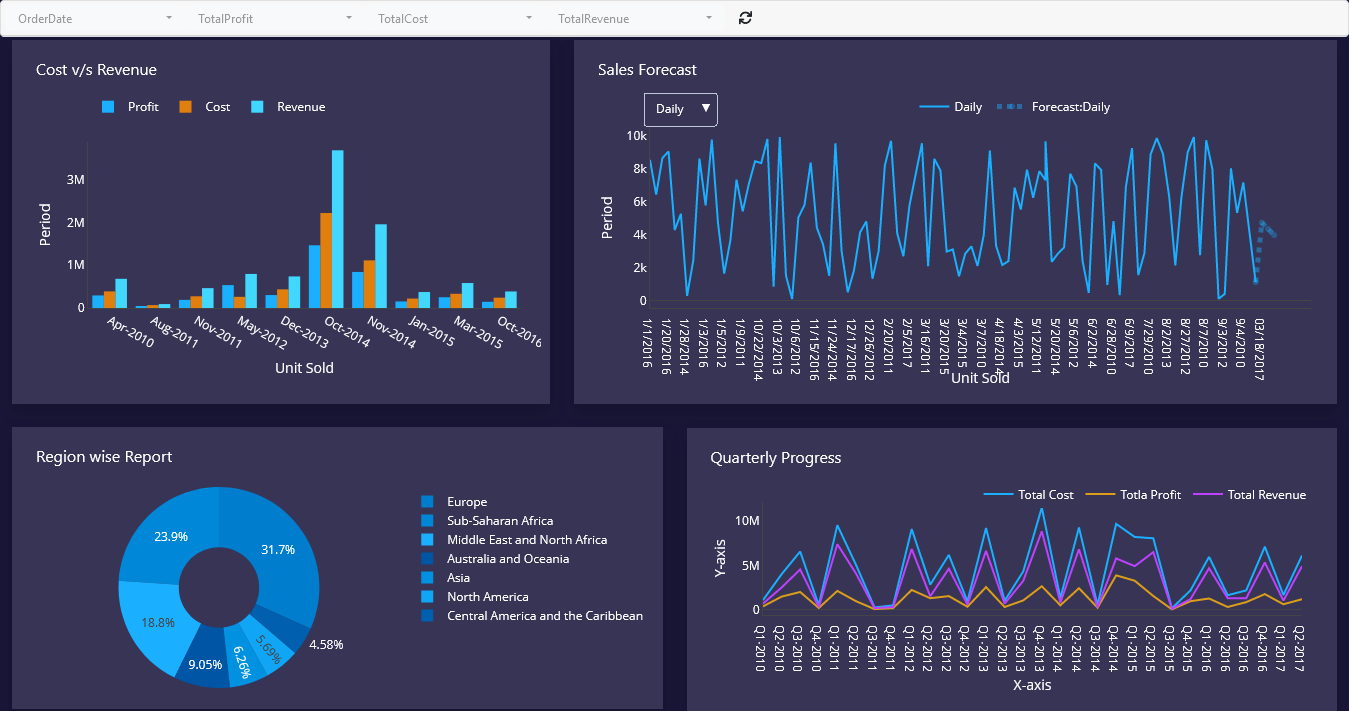
A business dashboard is a visual interface that consolidates data from databases, CRMs, and spreadsheets onto a single screen to track real-time KPIs. With Business Dashboard Builder, you can create customized, interactive business dashboards using drag-and-drop tools and auto-generated PHP and HTML5 code—no heavy BI software required.
On this page
- What is an AI Business Dashboard?
- Track Business Metrics in One View
- How to Create a Business Dashboard (Step-by-Step)
- The Evolution of Business Dashboards
- The Advantages of Business Dashboards
- Business Dashboards Best Practices
- Case Studies: Business Dashboard Success
- Business Intelligence Dashboard Features
- Business Dashboard Examples & Templates
- What Business Dashboard Software Solution Is Best?
What is an AI Business Dashboard?
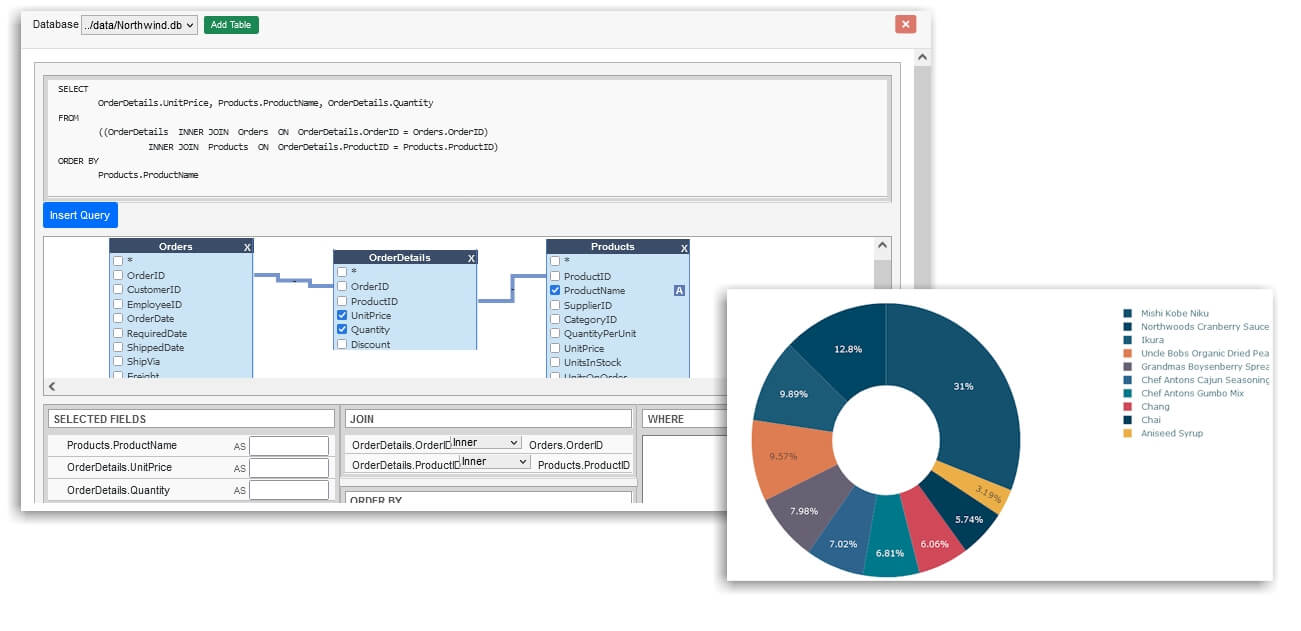
A business dashboard is an interactive visual interface that consolidates live data from MySQL, Postgres, Oracle, SQL databases, spreadsheets, and PDFs onto a single screen to track real-time KPIs. Powered by Smart Query AI, modern dashboard builders allow executives, managers, and developers to generate dynamic charts, automate database queries, and export clean PHP/HTML5 code, WP, Joomla, Laravel etc with drag-and-drop ease—no complex BI software required.
Track Business Metrics in One View
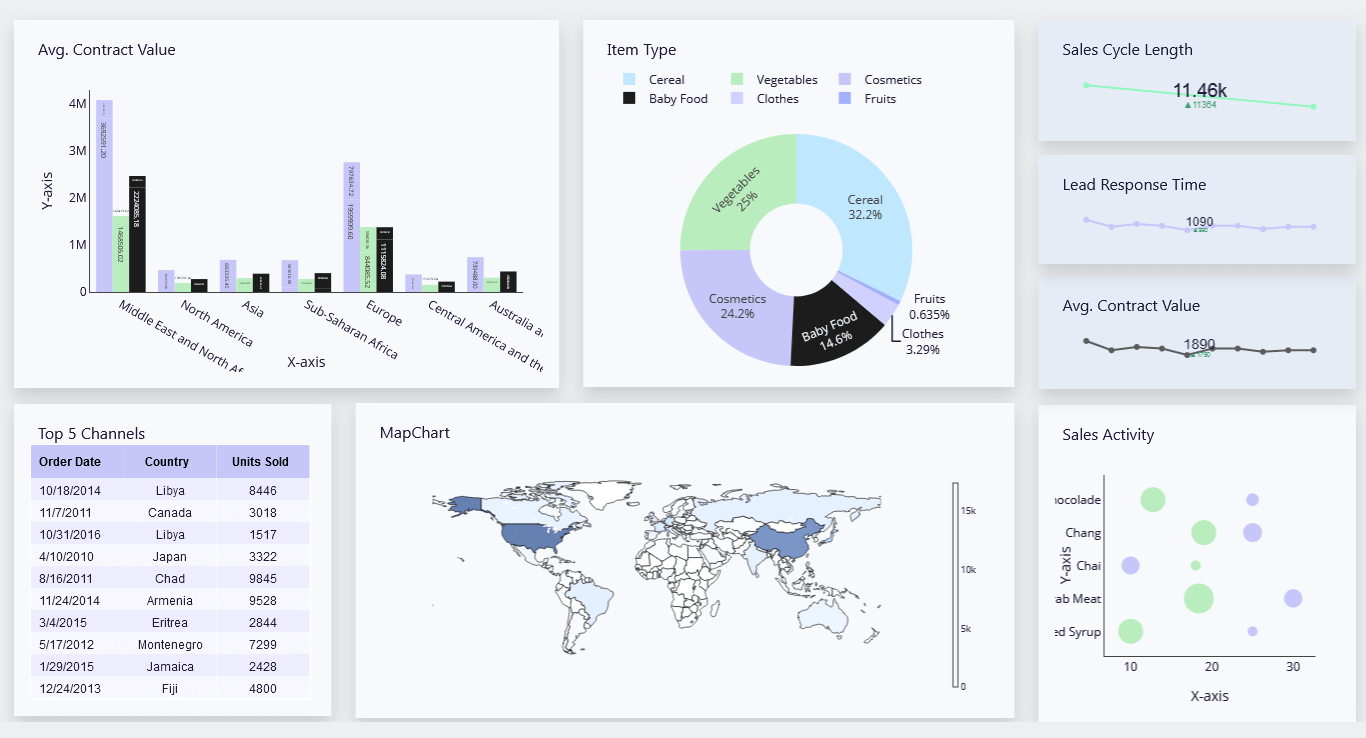
Instead of jumping between spreadsheets, CRM exports, and separate department reports, a business dashboard pulls your key business metrics into a single screen. Revenue, sales pipeline, marketing performance, operational efficiency, and HR metrics can all live side by side, updated from the same connected data sources. That single-pane-of-glass view lets teams spot a performance dip without waiting for manual weekly reporting.
How to Create a Business Dashboard (Step-by-Step)
Building a business dashboard comes down to eight straightforward steps, from defining your key metrics to publishing the finished view for your team.
Define your objective and audience. Start with each stakeholder's explicit goals—sales managers need granular SKU and regional filters, while executives need top-level summary metrics.
Identify the KPIs and metrics that matter. Pick the specific metrics that map directly to business objectives—such as revenue, pipeline, and conversion rates—rather than overloading the board with unnecessary data.
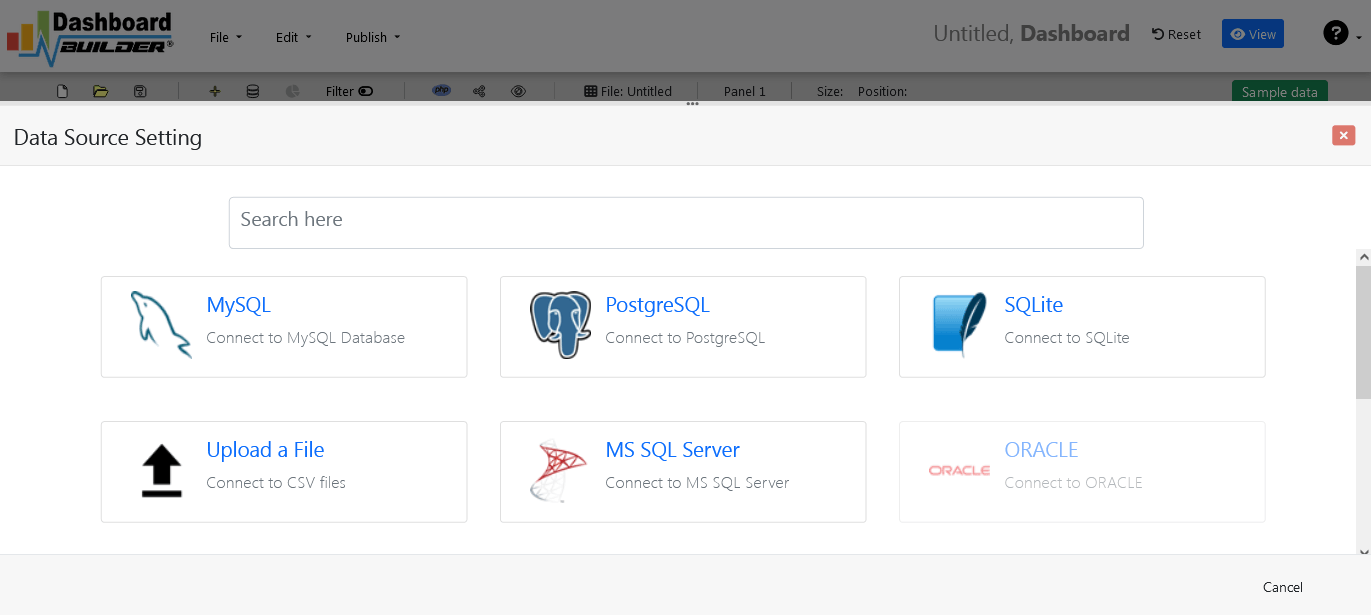
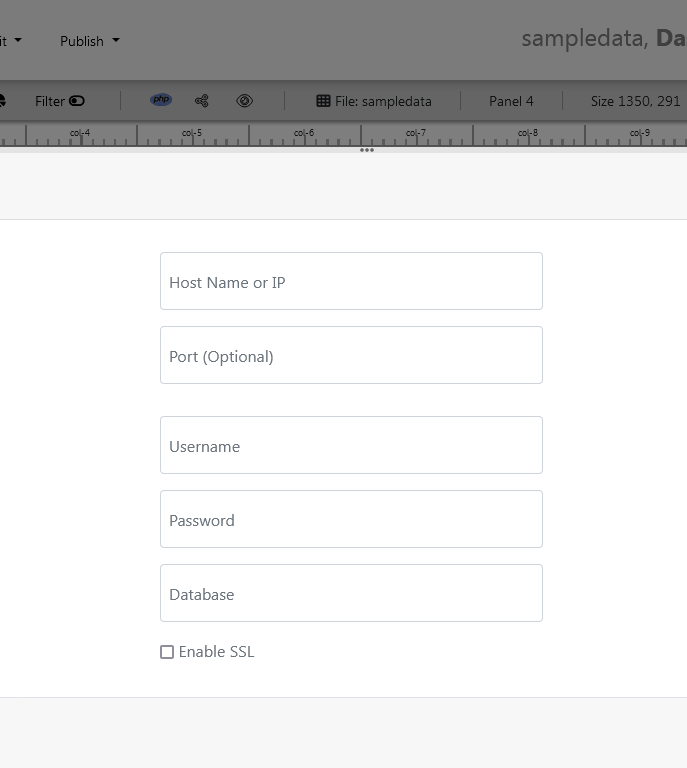
Connect your data sources. Link MySQL, MS SQL, PostgreSQL, Excel, or CSV files into one unified dashboard builder instead of managing isolated data silos.
3.1 Click on the Database icon in the Dashboard Software welcome screen.
3.2 Select MySQL or your preferred database engine as the data source.
3.3 Input your host, database name, and credentials.
3.4 Save the configuration to establish live connectivity.
Choose your chart types and layout. Match visualizations to data types—line charts for trend tracking, bar charts for comparisons, and KPI cards for direct figures.
Customize views per stakeholder. Construct role-based dashboard views so finance, sales, and operations teams see relevant metrics from the shared data pipeline.
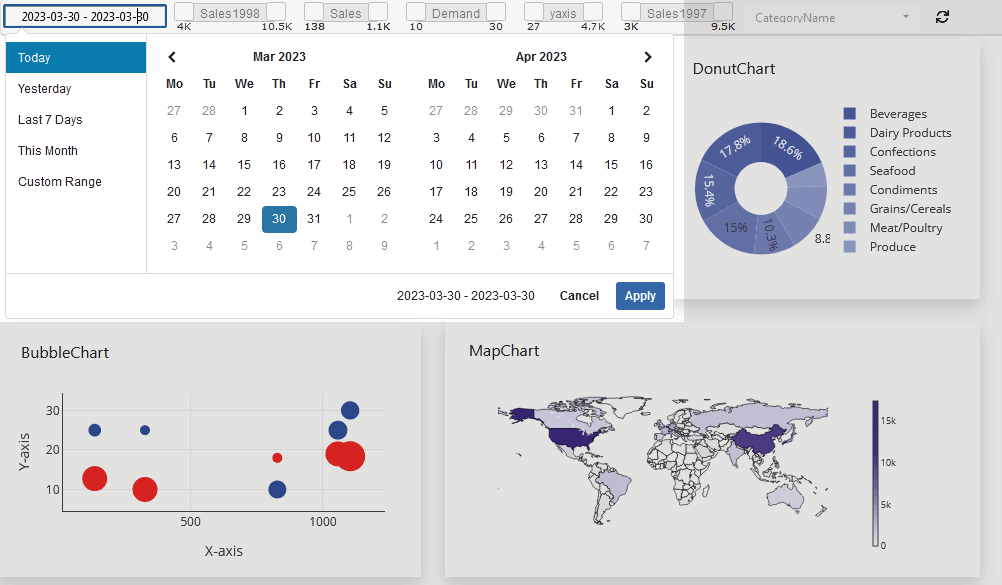
Add drill-down and filters. Enable interactive click-throughs so users can inspect high-level KPIs down to line items or regional metrics.
Validate data accuracy before publishing. Audit and verify data feeds across transformation steps to ensure absolute reporting reliability.
Publish and share your dashboard. Export clean PHP/HTML code, Joomla, WordPress, Laravel, output as PNG images, or embed live interactive dashboards directly into web applications or CMS portals.
Ready to build your first reporting board? Download Dashboard Builder for free to get started today.
The Evolution of Business Dashboards
Business dashboards have evolved significantly over the last four decades. Organizations used decision support systems (DSS) in the early 1970s before moving to Executive Information Systems (EIS) in the 1980s. Modern web-based dashboard builders leverage automated SQL queries, responsive HTML5 graphics, and real-time data connectors to deliver instant organizational clarity.
The Advantages of Business Dashboards
1. Enhance Decision-Making
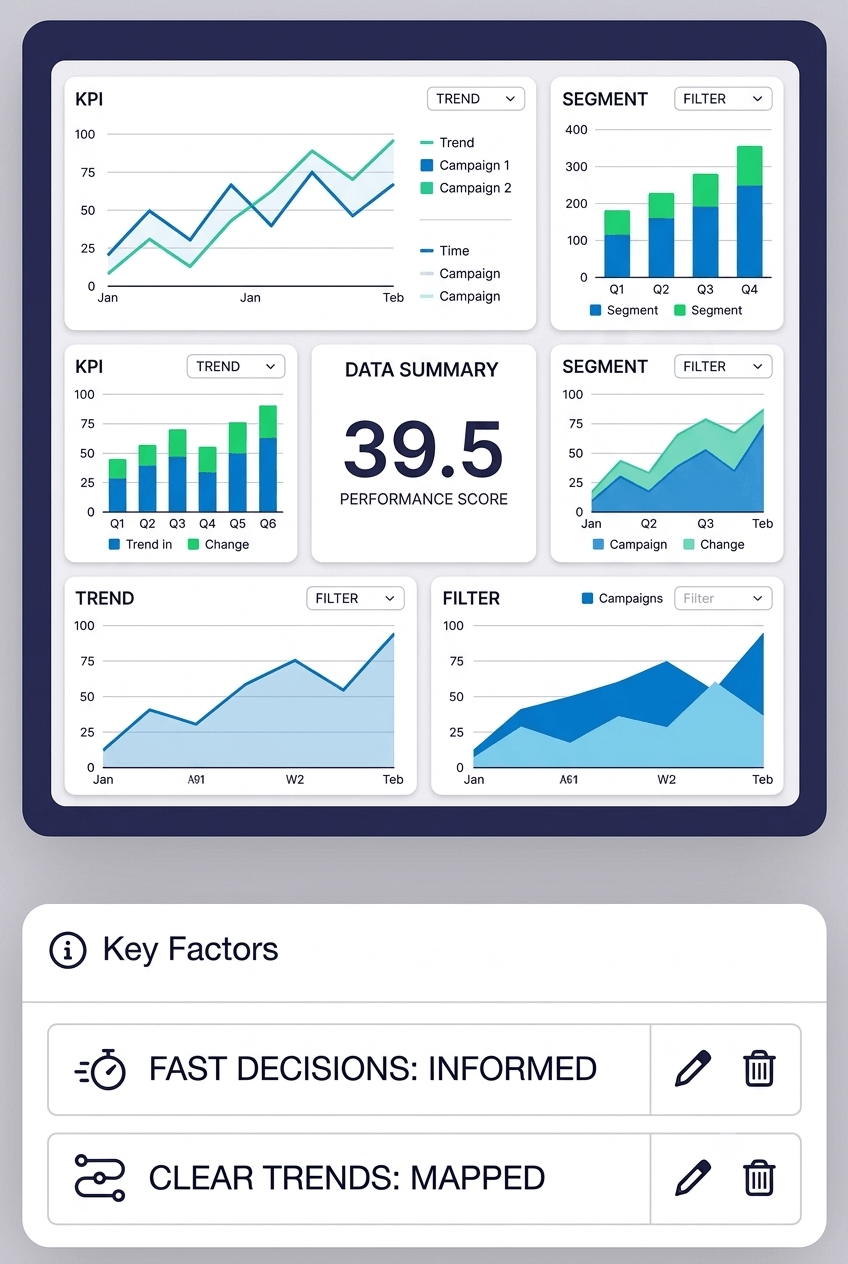
Aggregated data empowers fast leadership decisions, paired with dynamic graphs that track performance against time and key changes
2. Save Time & Automate Reporting
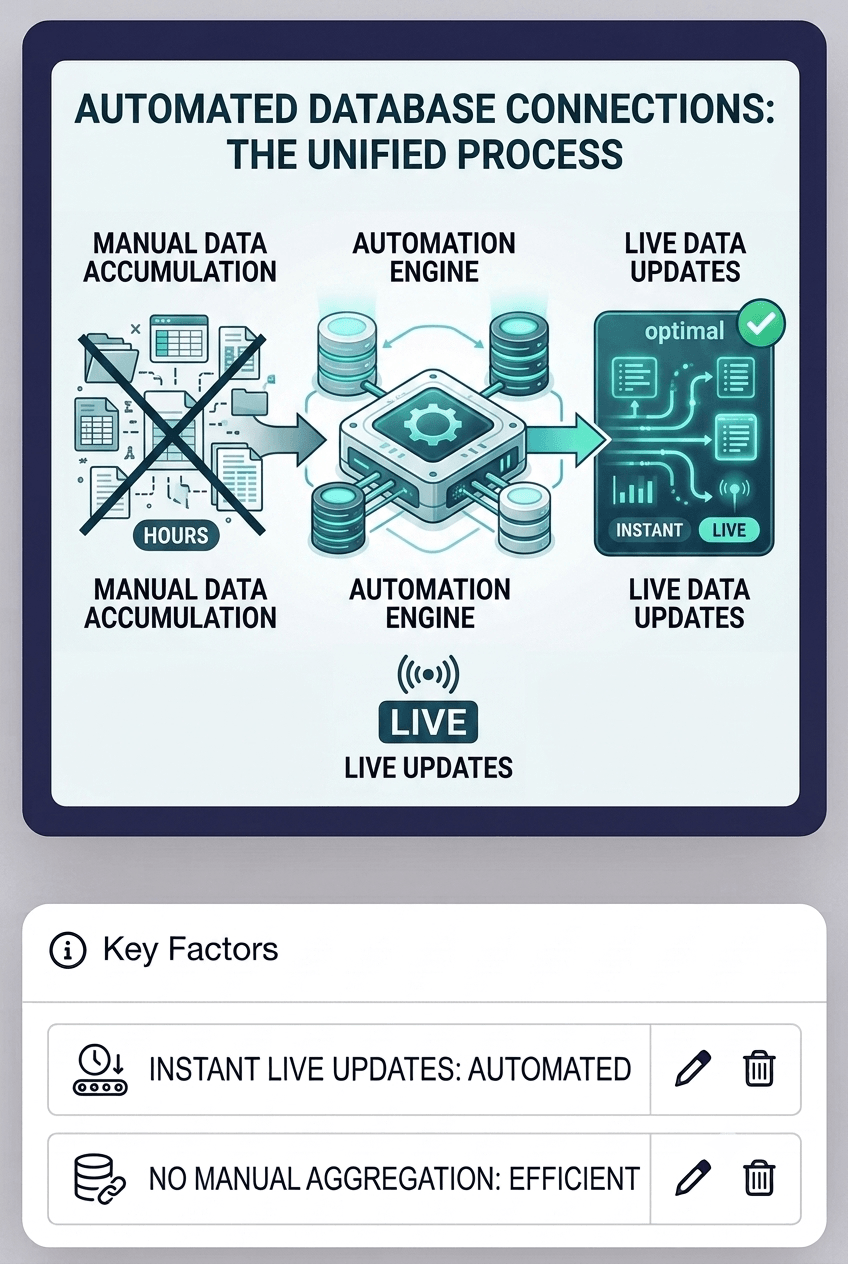
Automated database connections eliminate manual spreadsheet aggregation, reducing report generation times from hours to automated live updates.
3. Shareable Enterprise Insights
Providing direct dashboard access across departments fosters alignment between finance, marketing, sales, and executive management.
Business Dashboards Best Practices
1. Establish Dashboard Objectives
Align layout and widget choices directly with end-user goals before beginning design.
2. Ensure Data Accuracy
Implement validated database feeds to prevent bad decisions caused by corrupted reporting.
3. Apply Filters and Interactive Drill-Downs
Allow end users to filter by date ranges, geographical regions, or product categories without cluttering the primary summary layout.
Business Intelligence Dashboard Features
Dashboard Builder provides comprehensive BI capability directly on your server environment: