Applying Filter and Sort Data to a Chart or Dashboard
How to add filter and sort data option to a chart without programming.
You may occasionally fascinating to hide specific parts of your data in a chart, to focus in on certain data. The dashboard builder makes this problematic task for you in a simplistic way in just one click, without writing a single line of code.
You can apply row-level filters, sorting and interchanging for the data in all the charts in a dashboard despite using data coming from several data sources.
Note: Some chart types such as choropleth, Sankey, gauge, sunburst, and table do not have filter options.

How to add filter to a chart
Follow the steps below to apply the filter and sort data option to a chart or dashboard.
Assumption: You have already created a chart and wanted to add a filter option.
- Click the gear icon button.
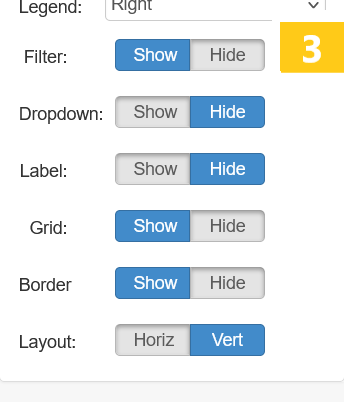
- In the next screen extends the Properties.
- Click the Show Filter button. 3
- Click the save changes button.

How to use the Filter option in a chart
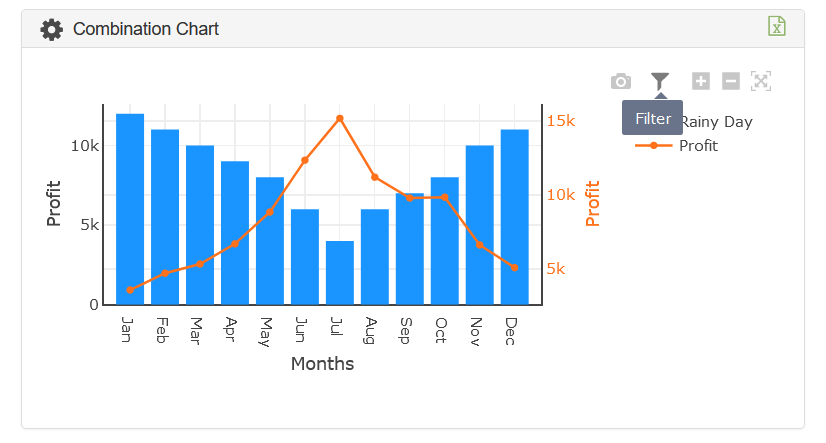
- Click the filter icon button
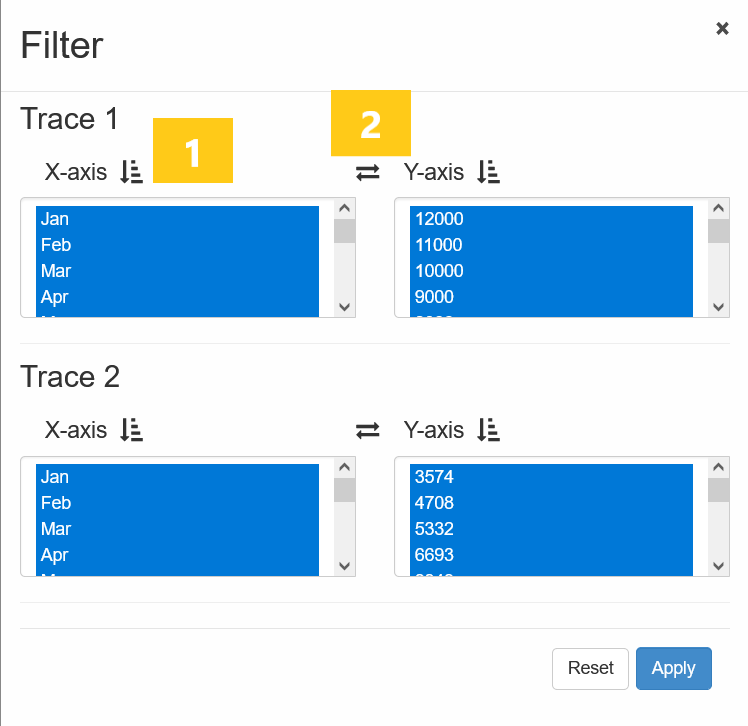
- In the next screen select X and Y axis data
- Click the Apply button
Note: the number of X and Y axis data must be the same.
How to use the sort data option in a chart
Note: You can sort either X or Y axis data at a time
How to use exchange X and Y data

How to restore your original chart
- Click the filter button
- Click the Reset button
How to add filter to a dashboard
Follow the steps below to apply a filter to the dashboard.
Assumption: You have already created a chart and added a filter.
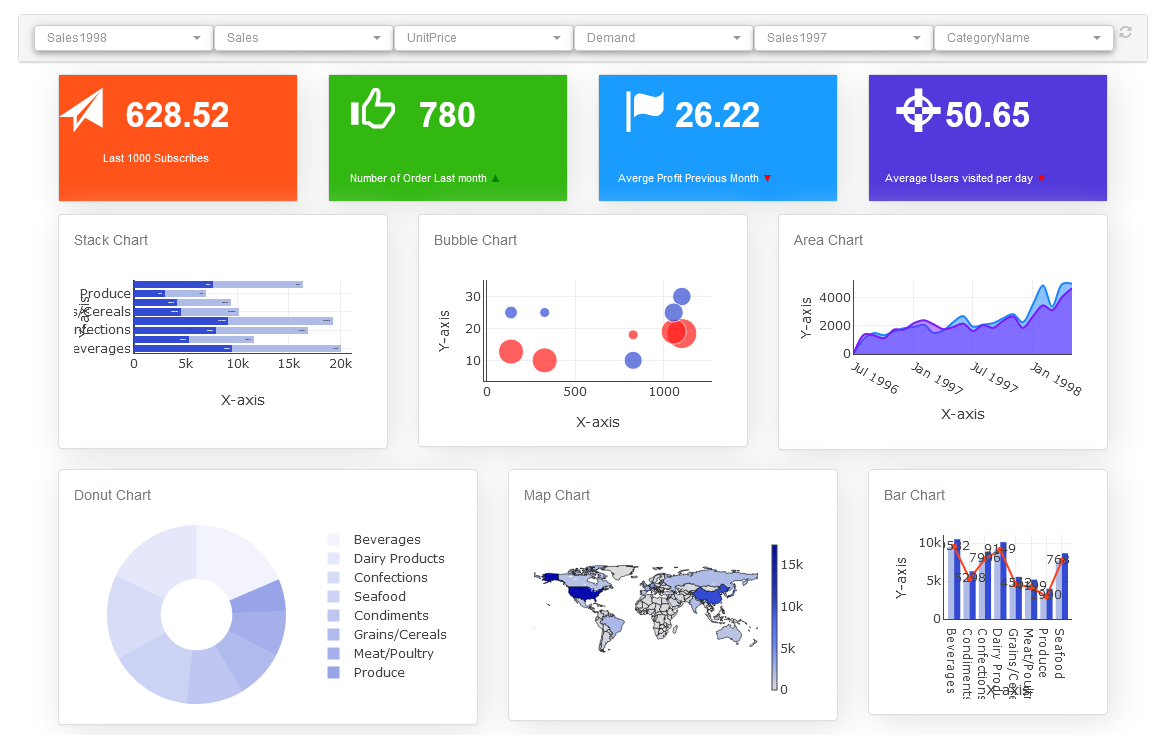
- Click the Filter button. 1
- A Rich Filter Controlle 2 automatically appears.

A Dashboard with Rich Filter Controller
