Dashboard Query Builder
Simplifying Data Querying and Visualization with the built-in Query Builder
The dashboard builder introduces a built-in query builder. With the query builder for visualization simplifies the process of querying and retrieving data, making it more accessible to you without extensive database or programming knowledge. The query builder empowers you to explore and analyze data efficiently and create meaningful visualizations that aid in decision-making and data-driven insights.
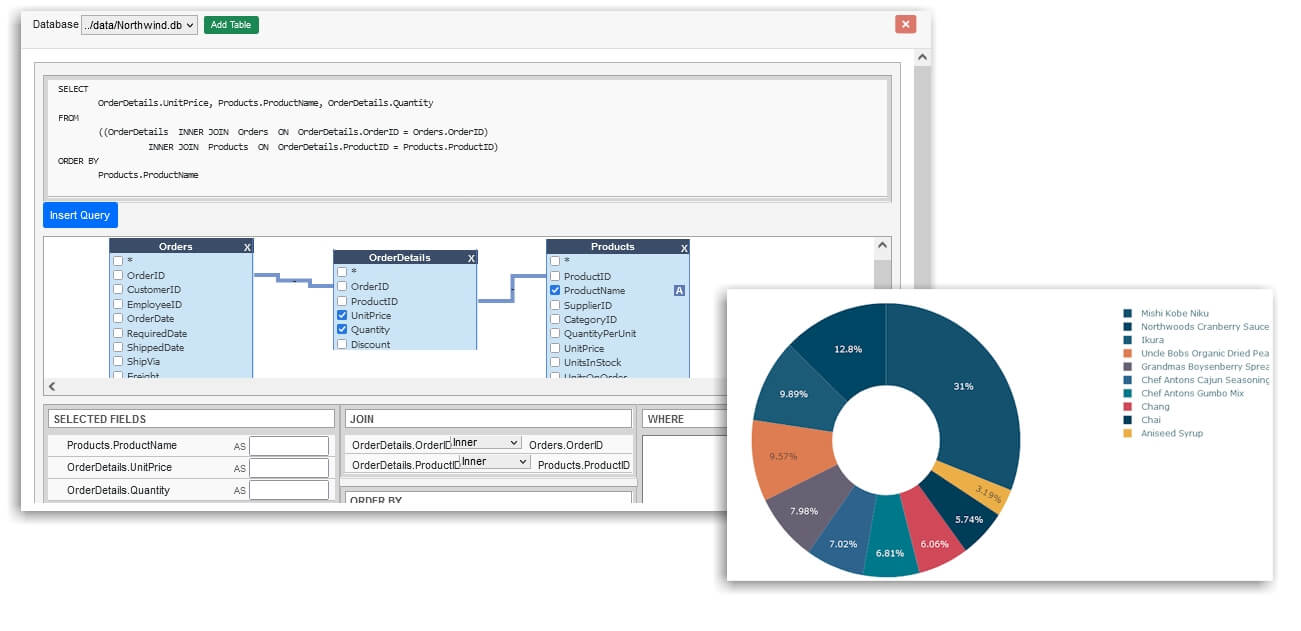
Query Builder Overview
The query builder is a powerful built-in tool of the dashboard builder that simplifies the process of querying and retrieving data by providing a user-friendly drag-and-drop interface with intuitive controls and options. The query builder eliminates the need for writing complex SQL statements, allowing you to visually construct queries using a drag-and-drop and point-and-click approach. With features like data source selection, query construction, joins and relationships, sorting and ordering, and seamless integration with the dashboard builder, the query builder empowers you to explore and analyze data efficiently, create meaningful visualizations, and gain valuable insights without requiring extensive database or programming knowledge.
You can run queries against your data using the query builder to make unique charts and other visualizations. Additionally, you can create unique dashboards with multiple charts.
Assumption: Dashboard Builder 6.2 or higher version is already installed
Exploring the Power of the Query Builder for Intuitive Insights
Modern business systems are a tangled web of data-generating components. You require a simple, reliable method for retrieving, analyzing, and visualizing the never-ending stream of data generated by your daily work activities. The purpose of a query builder is to simplify the process of querying data by providing a user-friendly interface with intuitive controls and options. Instead of writing complex SQL statements or code, you can leverage the query builder to visually construct queries using a drag-and-drop or point-and-click approach.
Here are the key components and features typically found in a query builder for visualization:
- Data Source Selection: The query builder allows you to choose the data source you want to query.
- Query Construction: The query builder provides a visual interface to define the structure and parameters of your query. You can specify the tables or collections to query, select the columns or fields you want to include, and apply filtering conditions to retrieve specific subsets of data.
- Joins and Relationships: If your data is distributed across multiple tables or collections, the query builder allows you to define joins or relationships between them. This enables you to combine data from different sources into a single query result.
- Sorting and Ordering: The query builder allows you to specify the sorting order of your query results based on one or more columns or fields. This feature is useful when you want to display the data in a particular sequence in your visualizations.
- Data visualization: Once you have constructed your query and obtained the desired data, the queried data is seamlessly integrated with data visualization tools and used as input for generating charts, graphs, or interactive dashboards.
- Integration: Quickly access your data and build customized charts to learn and understand the health of your infrastructure, applications, and other services.
- Real-time view: Add charts to your dashboards to obtain a complete real-time view of the state of your system.
Unlocking Actionable Insights: Empowering Data Analysis with Dashboard Query Builder
With the help of the query builder for the dashboard builder, you can easily gain insightful information from their data. It enables you with different technical backgrounds to engage in data analysis and come to wise decisions by streamlining the querying process, offering a user-friendly interface, and offering visual representations of the data. The query builder's integration abilities further boost its usefulness by enabling you to connect and combine data from various sources, promoting thorough analysis. Organizations can maximize the use of their data and encourage data-driven decision-making to effectively accomplish their objectives by using the query builder, a crucial part of the dashboard builder.
- Choose your data source The first step in creating a dashboard query using the query builder is choosing your data source. You can use a wide range of data sources, including MySQL, MS SQL, CSV, MS Excel, Google Sheet, JSON, PostgreSQL, ODBC, Oracle, Sybase, Cubrid & SQLite. The choice of your data source depends on the size and complexity of your data.
- Connect your data source to your visualization tool Once you have chosen your data source and visualization tool, the next step is to connect your data source to your visualization tool. Depending on your choice of tools, this process may differ slightly, but typically, you will need to follow the prompts to connect your data source to your visualization tool.

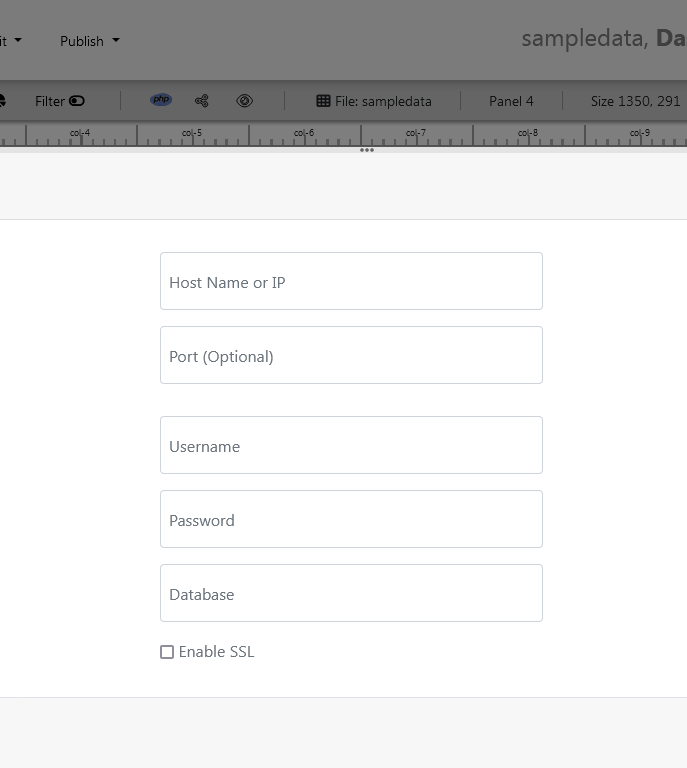
How to create effective data visualizations with Query Builder
Generating an SQL query using a query builder can be a straightforward process. Here is a step-by-step guide on how to generate an SQL query using a query builder:
Step 1: Access the Query Builder
Click the "Launch Query Builder button or navigate to the query builder under the chart settings section of your dashboard builder.

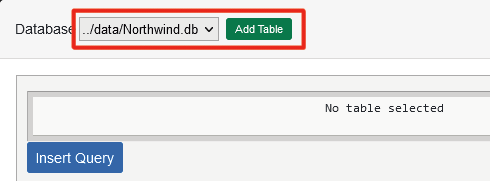
Step 2: Select Data Source
Choose the appropriate data source or database schema from which you want to access tables. This could be a specific database or a schema of multiple database.
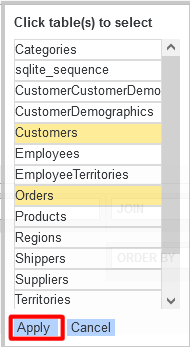
Step 3: Select Tables
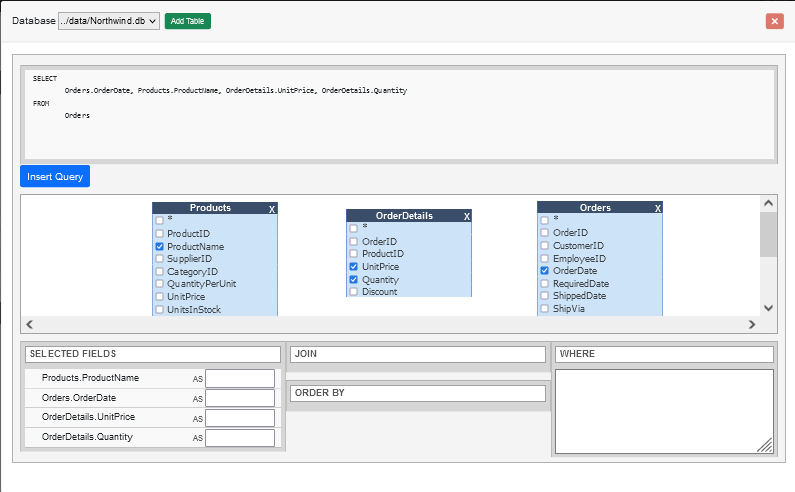
Select the table from which you want to retrieve data. This could be a single table, a view, or a combination of tables.
Step 3: Select Columns
Select the columns or fields that you want to include in your query. You can choose individual or multiple columns as per your desire from multiple tables.
Step 4: Define Filters and Conditions
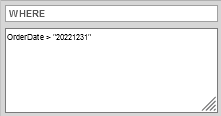
Specify any filters or conditions to narrow down the data based on specific criteria. This could include conditions like WHERE clauses, comparison operators, or logical operators to refine your data selection.
Step 5: Add Joins (if needed)
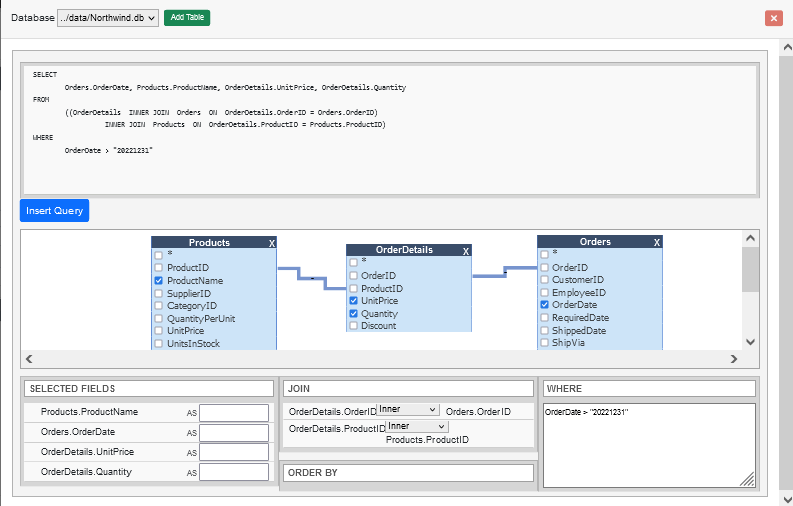
If you need to combine data from multiple tables, add the necessary joins to link the related tables based on their keys or common fields. Specify the join type, such as inner join, left join, or right join, depending on your requirements by using the drag-and-drop.

Step 6: Apply Sorting (optional)
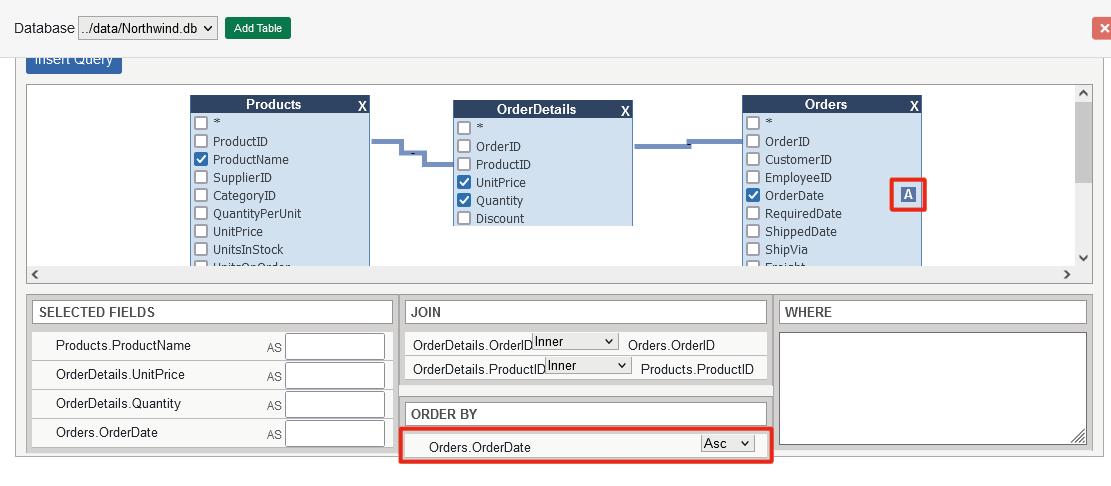
If you want the query results to be sorted in a particular order, specify the sorting criteria. You can sort data based on one or more columns in ascending or descending order by clicking the field in the table.
Step 8: Preview and Refine
Preview the generated SQL query to ensure it reflects your desired data retrieval and manipulation requirements. If needed, make adjustments by going back to previous steps to modify columns, conditions, joins, sorting, or grouping.
Step 9: Insert the SQL Query
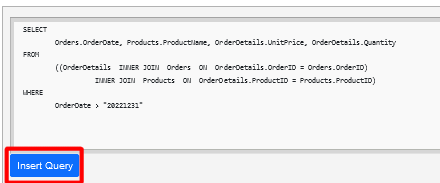
Once you are satisfied with the query configuration, click on the "Insert Query" to insert the SQL query to the dashboard builder based on your selections.
Step 10: Execute
At this point, you can choose to execute the generated SQL query directly against the database to retrieve the results by clicking the "Run Query" button for creating your chart.

Step 11: Assign data to your Chart
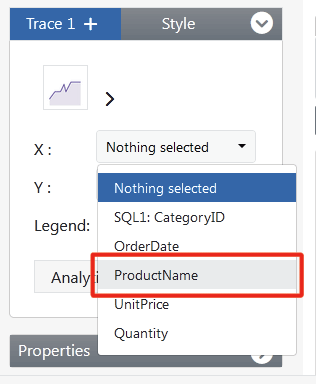
Finally, you can add an X and Y axis field to your graph to create a chart.
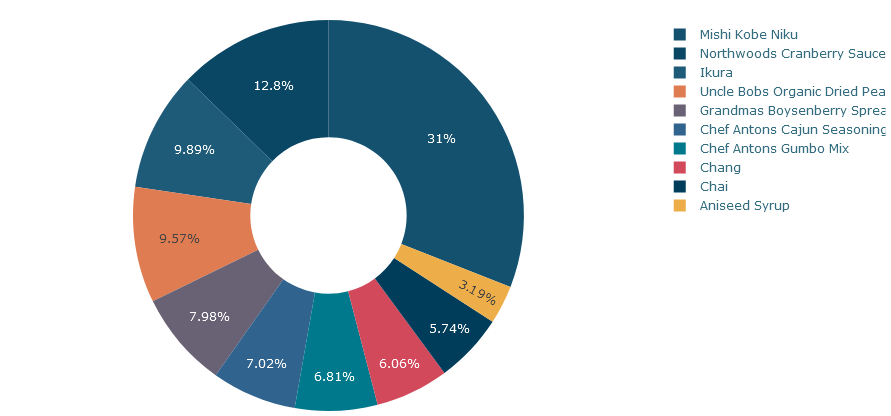
A Pie Chart created using the Query Builder
How helpful was this information?
Related topics
- Dashboard Query Builder
- Simplifying Data Querying and Visualization with the built-in Query Builder
- Query Builder Overview
- Exploring the Power of the Query Builder for Intuitive Insights
- Unlocking Actionable Insights: Empowering Data Analysis with Dashboard Query Builder
- How to create effective data visualizations with Query Builder
- Step 1: Access the Query Builder
- Step 2: Select Data Source
- Step 3: Select Tables
- Step 3: Select Columns
- Step 4: Define Filters and Conditions
- Step 5: Add Joins (if needed)
- Step 6: Apply Sorting (optional)
- Step 8: Preview and Refine
- Step 9: Insert the SQL Query
- Step 10: Execute
- Step 11: Assign data to your Chart
- A Pie Chart created using the Query Builder
- Video tutorial on how to a chart using Query Builder
- How helpful was this information?