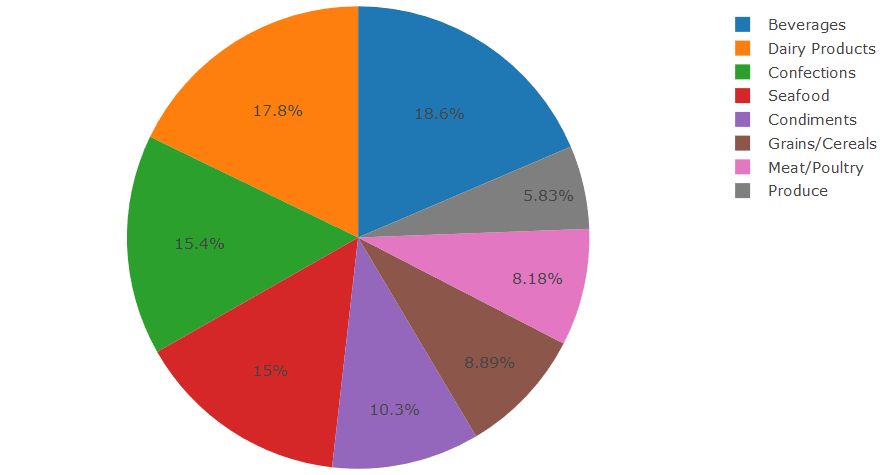
Create your dynamic D3.js based charts without writing a single line of code for your dashboards with Dashboard Builder and generate PHP code for your web application.
Fully HTML5 Responsive D3.js based charts
Build your fully responsive D3.js bases charts and generate PHP code in a minute. With Dashboard Builder, you can create interactive database driven HTML5 D3.js bases charts and generate code for your PHP application.
Compose your D3.js based chart using drag & drop with No Coding Required
Build your D3.js bases charts using our beautiful web-based drag and drop interface, without writing a single line of code.
Need data for your D3.js based charts from a database?
Dashboard Builder allows you to connect and retrieve data from MySQL, MS SQL,Oracle, PostgreSQL, Sybase, Cubrid & SQLite and generates D3.js based chart in real-time.
/**
 * DashboardBuilder
 *
 * @author Diginix Technologies www.diginixtech.com
 * Support  - http://www.dashboardbuilder.net
 * @copyright (C) 2017 Dashboardbuilder.net
 * @version 1.0.1
 * @license: license.txt
 */

include("inc/dashboard_dist.php");  // copy this file to inc folder

// for chart #1
$data = new dashboardbuilder();
$data->type[0]=  "pie";

$data->source =  "Database";
$data->rdbms =  "sqlite";
$data->servername =  "";
$data->username =  "";
$data->password =  "";
$data->dbname =  "../data/Northwind.db";
$data->xaxisSQL[0]=  "select c.categoryname, sum(a.quantity) as ^Sales 1997^, sum(a.quantity)+1000 as ^Sales 1998^ from products b, `Order Details` a, categories c where a.productid = b.productid and c.categoryid = b.categoryid group by c.categoryid order by c.categoryid";
$data->xaxisCol[0]=  "Sales 1998";
$data->yaxisSQL[0]=  "select c.categoryname, sum(a.quantity) as ^Sales 1997^, sum(a.quantity)+1000 as ^Sales 1998^ from products b, `Order Details` a, categories c where a.productid = b.productid and c.categoryid = b.categoryid group by c.categoryid order by c.categoryid";
$data->yaxisCol[0]=  "CategoryName";

$data->name = "col0";
$data->title = "Pie Chart";
$data->orientation = "";
$data->xaxistitle = "Time";
$data->yaxistitle = "Days";
$data->showgrid = "";
$data->showline = "";
$data->height = "";
$data->width = "";
$data->tracename[0]=  "area";

$result[0] = $data->result();
?>

<!DOCTYPE html>
<html>
<head>
	<script src="assets/js/dashboard.min.js"></script> <!-- copy this file to assets/js folder -->
	<!--<link rel="stylesheet" href="assets/css/bootstrap.min.css"> Bootstrap CSS file, change the path accordingly -->

<style>
<!-- adjust the height width as per your need -->;
/*
#col0{
height:350px;
}
#col1{
height:350px;
}
*/
</style>

</head>
<body>

<div class="container">
<div class="col-lg-12">
<div class="panel panel-default">
<div class="panel-heading"></div>
    <div class="panel-body">
        <?php echo $result[0];?>
    </div>
</div>
</div>
</div>
</body>
Loading....
