PHP Business Intelligence (BI) tool – Download FREE
Unlock the power of your data with PHP Business Intelligence
PHP Business Intelligence (BI) tool written in PHP is software application that are specifically designed to help businesses analyze, visualize and present data in a way that helps decision-makers make informed and effective decisions. These tools are built on top of PHP, JQuery and Bootstrap, which are the most popular open-source scripting languages used for web development.
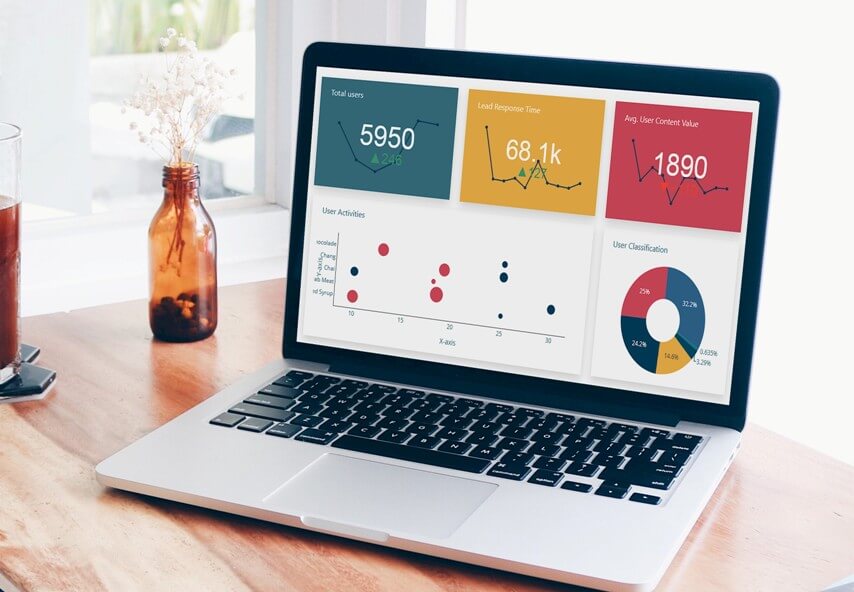
PHP Business Intelligence (BI) Overview
The PHP BI tool is designed to assist businesses in gathering, compiling, and analyzing vast amounts of data from various sources. It is done by mining data for insightful information using sophisticated algorithms and statistical techniques, which enables businesses to make defensible decisions about their operations. These tools typically offer functions like reporting, data modeling, data integration, and data visualization.
Experience the advantages of PHP BI Tools
One of the main benefits of PHP BI tool is that it requires little technical knowledge and is comparatively simple to use. It typically has user-friendly interfaces that let users access and analyze data without having to be familiar with difficult programming languages. With these tools, businesses can quickly get up and running without having to spend money on pricey IT resources.
Another advantage of PHP BI tool is that it is highly customizable. It is easy to integrate with existing PHP software applications and databases, enabling businesses to tailor it to meet their specific requirements. As a result, businesses can use this tool to analyze and visualize data in a way that is most relevant to their operations.
The PHP BI tool has unique set of features and capabilities. Some of the most popular are include:
- It allows businesses to connect to various data sources, including MySQL, MS SQL, CSV, MS Excel, Google Sheet, JSON, PostgreSQL, ODBC, Oracle, Sybase, Cubrid & SQLite.
- It provides a user-friendly interface for analyzing data and generating PHP code.
- It provides a user-friendly interface for creating visualizations and dashboards including 3D, line, bar, pie, donut, bubble, stack, area, heatmap, histogram, gauge, sankey diagrams, sunburst, table and choropleth map.
- It automatically fetches latest and most current data available with real-time streaming and updates dashboard in real time without reloading the entire page.
- Regularly monitor the data on your dashboard and look for trends, patterns, and anomalies. Use this information to make data-driven decisions and drive continuous improvement in your organization.
PHP BI tool Tutorial
Unleash the Power of Data with Our FREE PHP BI Report Generator
APPLIES TO: On-premises Online Desktop
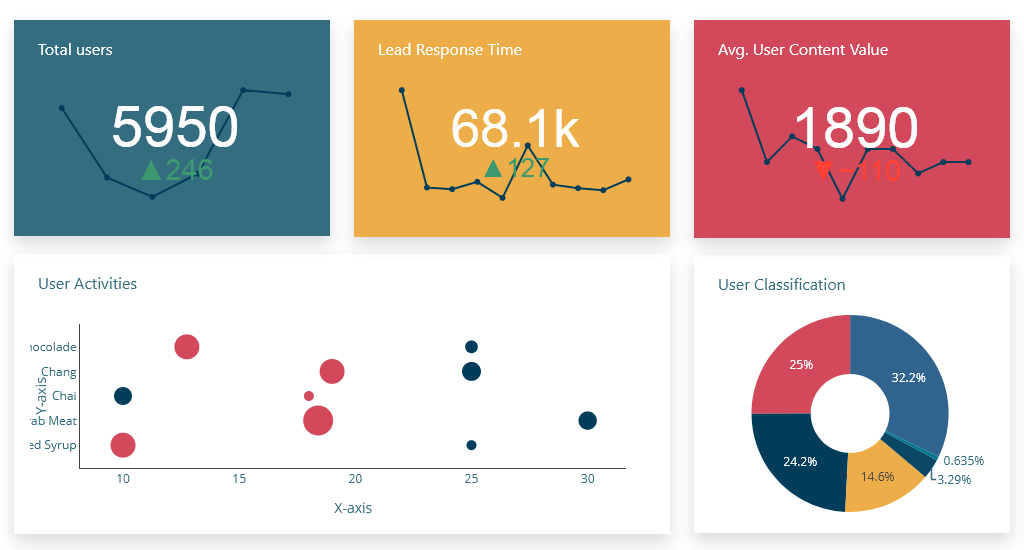
In this article, we'll use the Dashboard Builder Tool to create a Business Intelligence Report and retrieve data from a MySQL database, as well as generate PHP source code.
Requirements
- PHP Version 7.2 or later
- Apache 2 or later
- Windows 7 or later /Linux 3 or later
- Firefox 52, Chrome 57, IE 8
Installation
- Download from Download Dashboard Builder
- Place the file in a directory on the web server. e.g.
…/www/dashboar/dbuilder/ - Unzip
 the file using Extract Here option to the root folder of "dashboardbuilder"
Launch the Dashboard Builder application
- Access the web folder in your browser. e.g. http://localhost/dashboardbuilder following welcome screen will appear
Fetch data from MySQL
With the help of the following easy steps, you can fetch complex data from the MySQL database and create the highest level of extremely attractive predictive analytic dashboards for professional businesses with no code and without programming skills required, in a matter of minutes.
- Retrieve data from MySQL dashboard
- Assign data to X and Y-axis column.
Retrieve data from MySQL dashboard
This section of the article helps you to understand how to connect to the MySQL database. To proceed further, you need to make sure that you have already installed the dashboard builder tool and you meet all the prerequisites .
- STEP-1 Launch the dashboard builder, if you are using on-prem version then run the dashboard builder in a browser
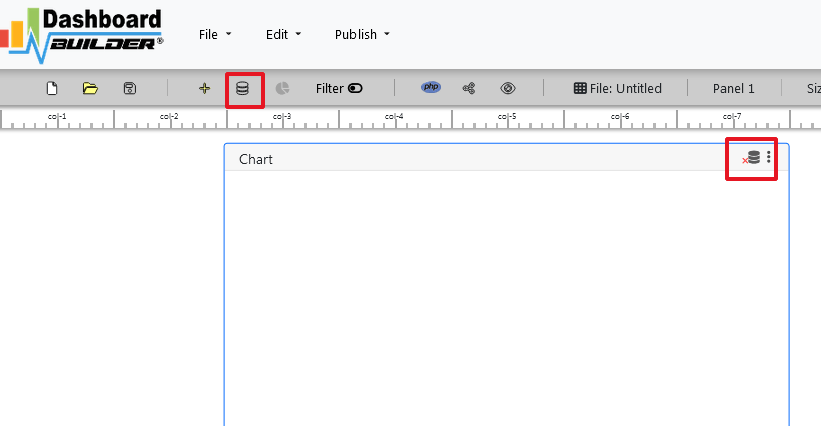
- STEP-2 Click the database icon
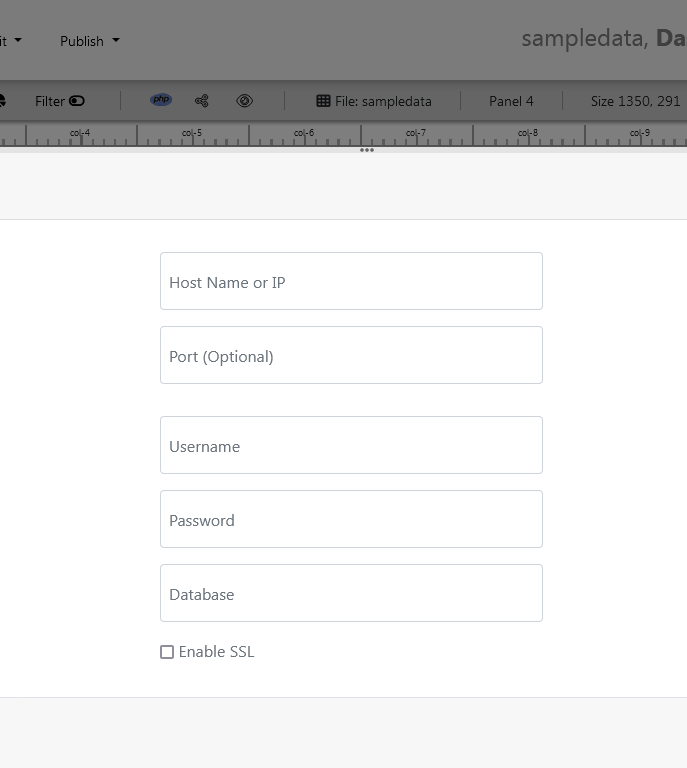
- STEP-3 On the database tab, enter the database credentials of your database and hit the Save Changes button.
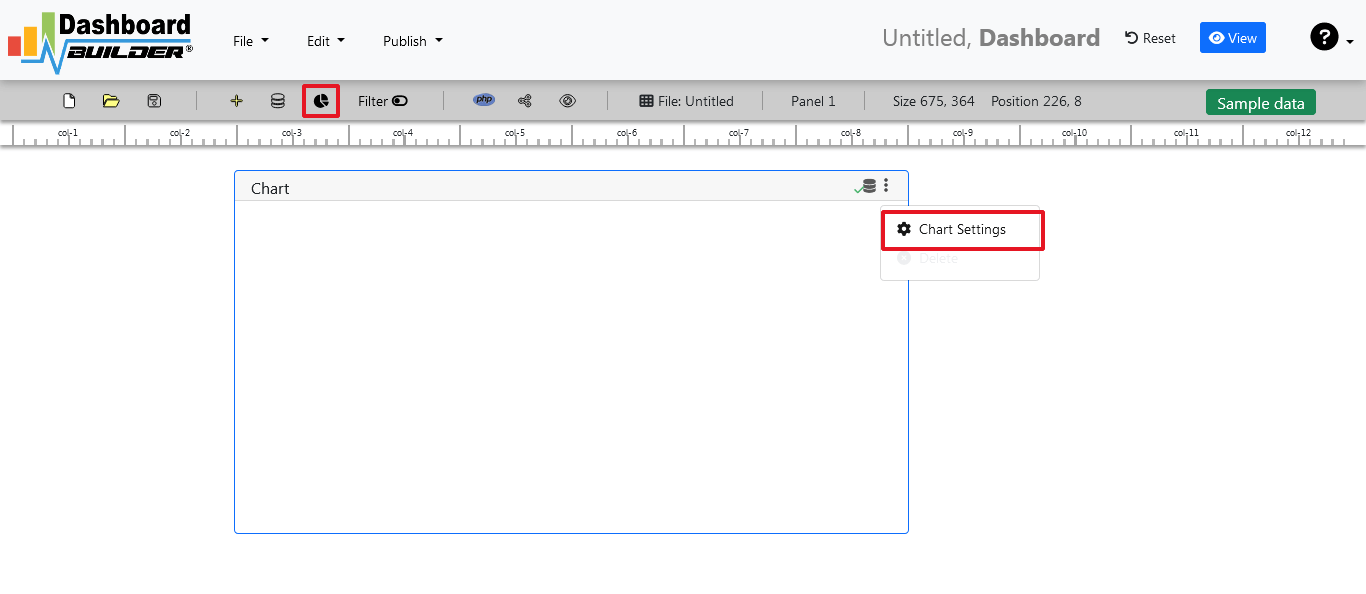
- STEP-4 Click the gear icon to open the chart properties windows
- STEP-5 On the next screen; select Line graph from the drop-down list of chart type. Select order date in X-axis and unit sold in Y-axis
- STEP-6 Now, click the Analytics tab.
- STEP-7 Save your changes and your business forecasting dashboard is ready. You have various options to publish your forecasting dashboard.



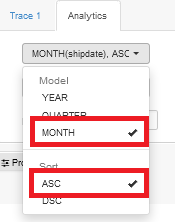
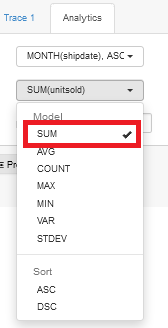
Aggregate sum monthly sales by check the month on X-axis in ascending order and Sum on Y-axis.
You must have a date in your X-axis in order to forecast your sale otherwise this button would not be enabled.
We can see here again in the solid line this is our actual data. And then based on the actual data and pattern over time with that data, the dashboard builder can through various statistical algorithms produces a forecast of what we should expect.
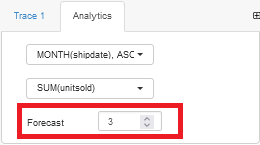
Enter the number of iterations we want to the dashboard builder to forecast.
Generating BI reports with PHP source code
/**
 * DashboardBuilder
 *
 * @author Diginix Technologies www.diginixtech.com
 * Support  - http://www.dashboardbuilder.net
 * @copyright (C) 2018 Dashboardbuilder.net
 * @version 2.1.7
 * @license: license.txt
 */

include("inc/dashboard_dist.php");  // copy this file to inc folder


// for chart #1
$data = new dashboardbuilder();
$data->type =  "pie";

$data->source =  "Database";
$data->rdbms =  "mysql";
$data->servername =  "";
$data->username =  "";
$data->password =  "";
$data->dbname =  "northwind";
$data->xaxisSQL[0]=  "SELECT strftime(^%Y-%m^,o.shippeddate) as xaxis, sum(d.quantity) as yaxis from `order details` d, orders o  where o.orderid = d.orderid group by strftime(^%Y-%m^,o.orderdate) limit 50";
$data->xaxisCol[0]=  "xaxis";
$data->yaxisSQL[0]=  "SELECT strftime(^%Y-%m^,o.shippeddate) as xaxis, sum(d.quantity) as yaxis from `order details` d, orders o  where o.orderid = d.orderid group by strftime(^%Y-%m^,o.orderdate) limit 50";
$data->yaxisCol[0]=  "yaxis";
$data->name = "piechart";
$data->title = "Pie Chart";
$data->orientation = "";
$data->xaxistitle = "x-axis title";
$data->yaxistitle = "y-axis title";
$result[0] = $data->result();

?>

<!DOCTYPE html>
<html>
<head>
	<script src="assets/js/dashboard.min.js"></script> <!-- copy this file to assets/js folder -->
	<!--<link rel="stylesheet" href="assets/css/bootstrap.min.css"> Bootstrap CSS file, change the path accordingly -->


</head>
<body>

<div class="container">
<div class="col-lg-12">
<div class="panel panel-default">
<div class="panel-heading"></div>
    <div class="panel-body">
        <?php echo $result[0];?>
    </div>
</div>
</div>
</div>
</body>
PHP Business Intelligence (BI) Report Example pages
Whether you're looking for inspiration or just want to take a quick look at your clients, a pre-made sample page can get your project started. Creating charts and graphs in PHP BI has never been easier.
Conclusion
In conclusion, the PHP BI tool is an essential part of any business's data analysis and decision-making process. It gives your businesses the ability to rapidly and effectively gather, arrange, and analyze vast amounts of data. With it’s user-friendly interfaces and customizable features, this tool is accessible to businesses of all sizes and technical expertise. If you're looking to improve your business's data analysis capabilities, a PHP BI tool is an excellent investment..
 the file using Extract Here option to the root folder of "dashboardbuilder"