Dashboard Designer helps you to design your data-driven destiny available for FREE download
Dashboard Designer is a powerful tool that enables users to create interactive and visually appealing data visualization and analysis dashboards. It is frequently used in business intelligence and data analytics applications to present complex data sets in a clear and concise manner, allowing users to understand and derive insights from the data more easily.
A dashboard's function is to present a consolidated view of the metrics, trends, and key performance indicators (KPIs) that are pertinent to a given industry or business. Users can design and alter these dashboards using Dashboard Designer in accordance with their unique needs, ensuring that the information displayed is in line with their objectives and goals.
Dashboard Designer overview
DASHBOARD DESIGNER is a drag and drop utility that allows you to create custom dashboards without any coding or technical knowledge. You can select from a variety of widgets and data visualizations, such as charts, graphs, tables, and gauges, and arrange them on a canvas to create a dashboard that suits their needs.
Dashboard Designer- The Most Productive Design Tool For Interactive Dashboards
The dashboard designer tool is highly customizable, allowing you to personalize your dashboards based on your preferences and business goals. You can create a dashboard that matches your brand identity by selecting from a variety of color schemes, fonts, and themes.
Create excellent dashboards of the highest caliber using Dashboard Designer
Dashboard Designer is a popular data visualization tool that allows business users to effectively understand, visualize, and choose data to solve business problems. Dashboard Designer enables users to combine data from multiple sources into a single layout screen, create visual and graphical reports for analysis, and provide actionable information to all users.
Dashboard Designer provides you with several platform options to meet your business requirements. You can use it online or on your computer. It's free and works on both Mac and Windows.
Dashboard Designer is free to download and use online.
Dashboard Designer is available for free download and use online. It is available for download as well as online use. It's available in English,German, French, Spanish, Italian, Arabic, Russian, and Portuguese . The Dashboard Designer can be downloaded from the website here. It is also available at Github repository and is free to download.
Key Features of Dashboard Designer:
- Drag-and-Drop Interface: Dashboard Designer offers a user-friendly, drag-and-drop interface, allowing users to easily add various data visualization elements such as charts, graphs, tables, maps, and widgets to their dashboards. This intuitive interface eliminates the need for coding or extensive technical skills, enabling users of all levels to create compelling dashboards.
- Data Integration: Dashboard Designer provides capabilities to connect and integrate with various data sources, including databases, spreadsheets, cloud storage, and APIs. This allows users to retrieve and aggregate data from different systems and sources into a single dashboard, providing a comprehensive view of the relevant information.
- Visualization Options: Dashboard Designer offers a wide range of visualization options to present data effectively. Users can choose from different chart types (e.g., bar charts, line charts, pie charts), maps, gauges, and other graphical elements to represent data in a meaningful and visually appealing manner. This flexibility enables users to select the most appropriate visualization type for their specific data and insights they want to convey.
- Customization and Styling: Users can personalize their dashboards by customizing the layout, colors, fonts, and overall styling to match their brand or desired aesthetic. They can also define interactive elements, such as drill-down functionality, filters, and parameters, which allow viewers to explore the data further and focus on specific subsets of information.
- Collaboration and Sharing: Dashboard Designer often includes collaboration features that enable multiple users to work together on a dashboard project. This allows for teamwork, feedback, and contribution from different stakeholders. Additionally, dashboards can be easily shared with others through various means, such as embedding in websites or portals, exporting as PDFs or images, or granting access to specific users or user groups.
- Responsive Design: With the increasing use of mobile devices, responsive design has become crucial. Dashboard Designer supports responsive layouts, ensuring that the dashboards adapt and display optimally on different screen sizes and devices, including desktops, tablets, and smartphones.
- Real-time Data and Updates: Some Dashboard Designer tools provide real-time data connectivity, enabling users to connect to live data sources and display real-time updates in their dashboards. This feature is particularly valuable in dynamic environments where up-to-date information is critical for decision-making.
Customize your data visualization like never before with Dashboard Designer On-Premise Edition
Dashboard Designer On-Premise Edition is an ideal solution for organizations that need to create custom dashboards and reports while keeping their data within their own network. The tool is easy to use, yet powerful enough to handle even the most complex data sets.. Dashboard Designer can be installed directly on your computer and managed locally. The requirements of the on-premise version of Dashboard Designer are listed below.
Requirements:
Dashboard Designer can be installed on any platform like Windows, Linux, Ubuntu, or other media that supports Apache, Nginx, etc.
- PHP Version 7.2 or later
- Apache 2 or later
- Windows 7 or later /Linux 3 or later
- Firefox 52, Chrome 57, IE 8
Dashboard Designer's on-premises version allows you to publish and share your dashboards by either exporting them as PNG images or by creating PHP code, HTML Universal code, or Laravel packages.
Transform your data into beautiful visual stories with Online Dashboard Designer
Online Dashboard Designer is one such tool that empowers businesses to create stunning and interactive visualizations that bring their data to life. With its user-friendly interface, extensive library of customizable templates and charts, and real-time collaboration capabilities, Online Dashboard Designer is an excellent solution for businesses of all sizes looking to gain deeper insights into their data. With this tool, businesses can make data-driven decisions that drive growth, improve efficiency, and enhance overall performance.
Dashboard Designer generates the universal HTML code to display and share your charts or dashboard with the rapid development of web technologies (like APIs) on any website or web application. Not only that, Dashboard Creator helps you publish your charts and dashboards to multiple devices via export as a PNG image file.
The online version of Dashboard Designer also offers a FREE online dashboard builder, SaaS (Software as a Service) application by subscription with no license fees.
Requirements:
Online dashboard designer runs on all SVG-compatible browsers with an internet-connected computer.
Craft insightful visualizations effortlessly with Dashboard Designer
The dashboard designer tool is ideal for businesses that rely on multiple data sources. The tool can easily integrate data from different sources, allowing you to create a comprehensive dashboard that displays all your data in one place and generate the source code of your dashboard. This feature eliminates the need for you to switch between different applications or programs to access their data.
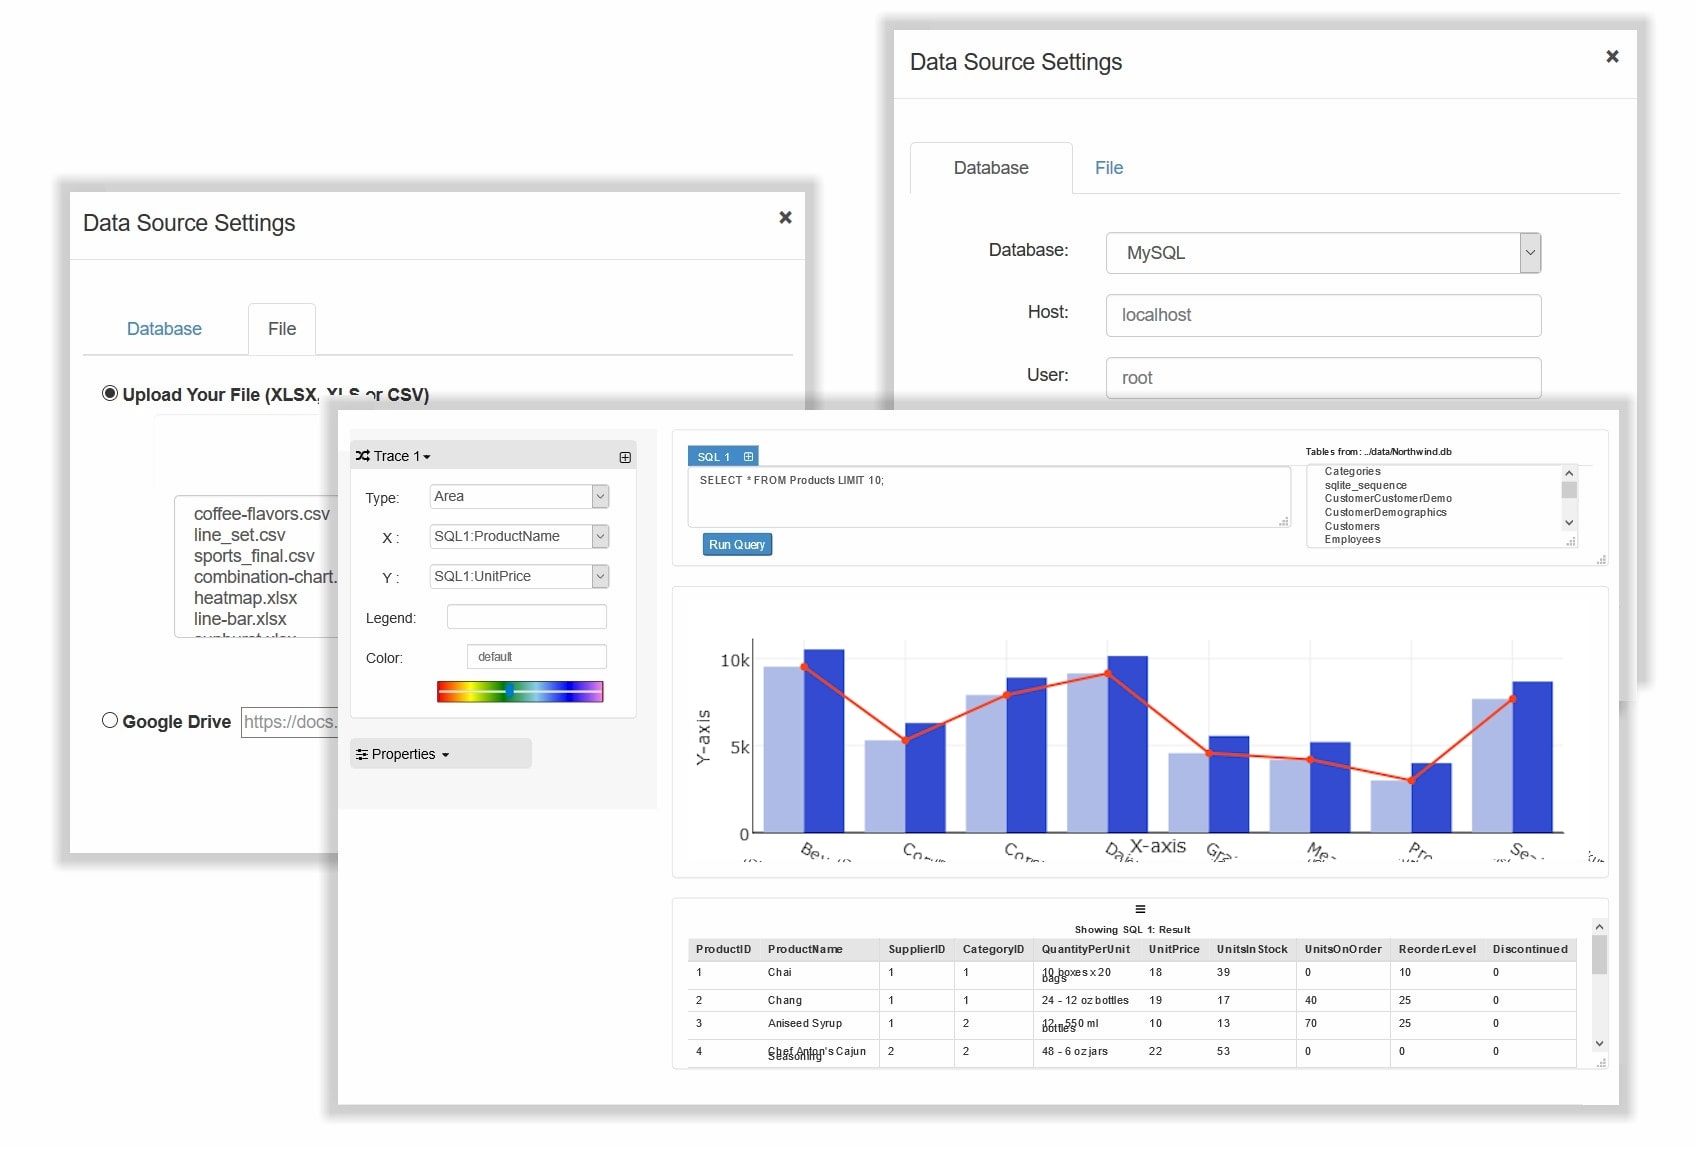
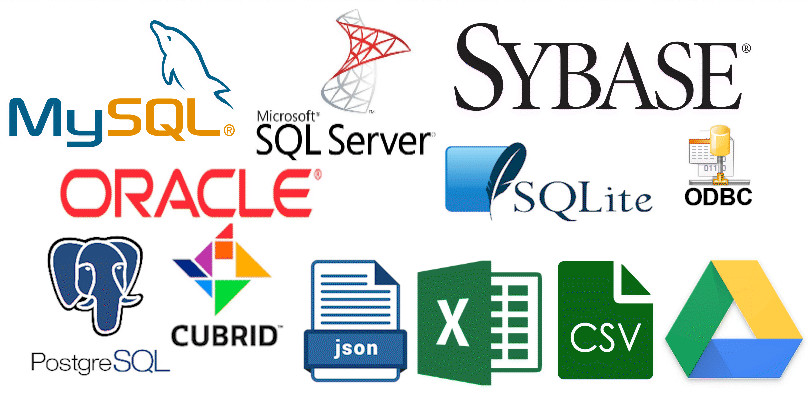
With Dashboard Designer, you have the flexibility to access and retrieve data from various sources including MySQL, MS SQL, Oracle, PostgreSQL, Sybase, Cubrid, CSV, MS Excel, and SQLite, enabling you to generate real-time dashboards. Additionally, Dashboard Designer Excel empowers you to create visualizations by seamlessly importing your data from Excel into a LAMP environment.
Create visually appealing dashboards effortlessly, using the latest high-tech drag-and-drop technology, without the need for any programming skills
One of the key benefits of a dashboard designer is speed. With a drag and drop designer tool, you can create a dashboard in a matter of minutes. This is a significant time saver compared to traditional methods of dashboard creation, which could take days or even weeks to complete
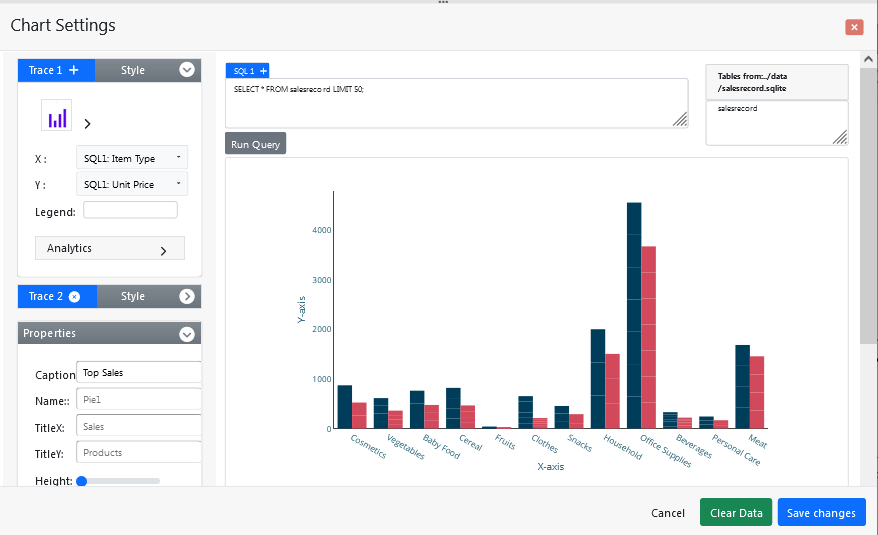
With Dashboard Designer, you can design stunning dashboards in just a matter of minutes using its remarkable drag-and-drop technology, without requiring any coding expertise. The platform also features a potent SQL code generator and an intuitive drag-and-drop dashboard builder interface that allows you to create visually compelling dashboards with ease. Upon selecting your database table, the system automatically generates optimized SQL code, streamlining the process of bringing your data to life.

Transform your data into stunning visuals with Dashboard Designer's diverse chart options and canvas presentation
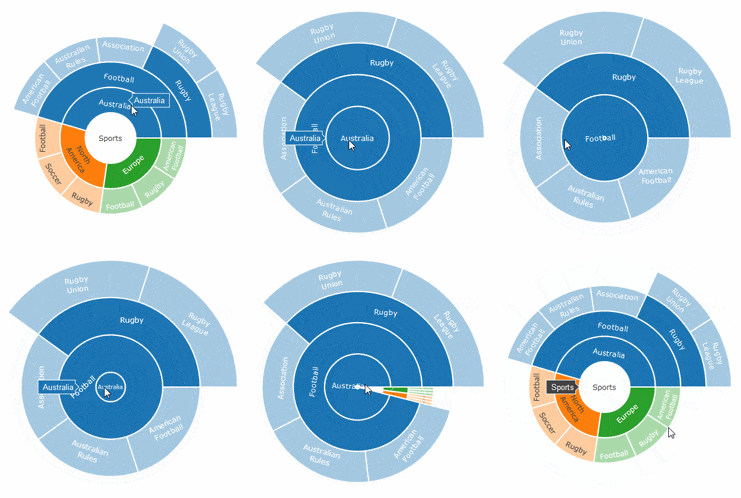
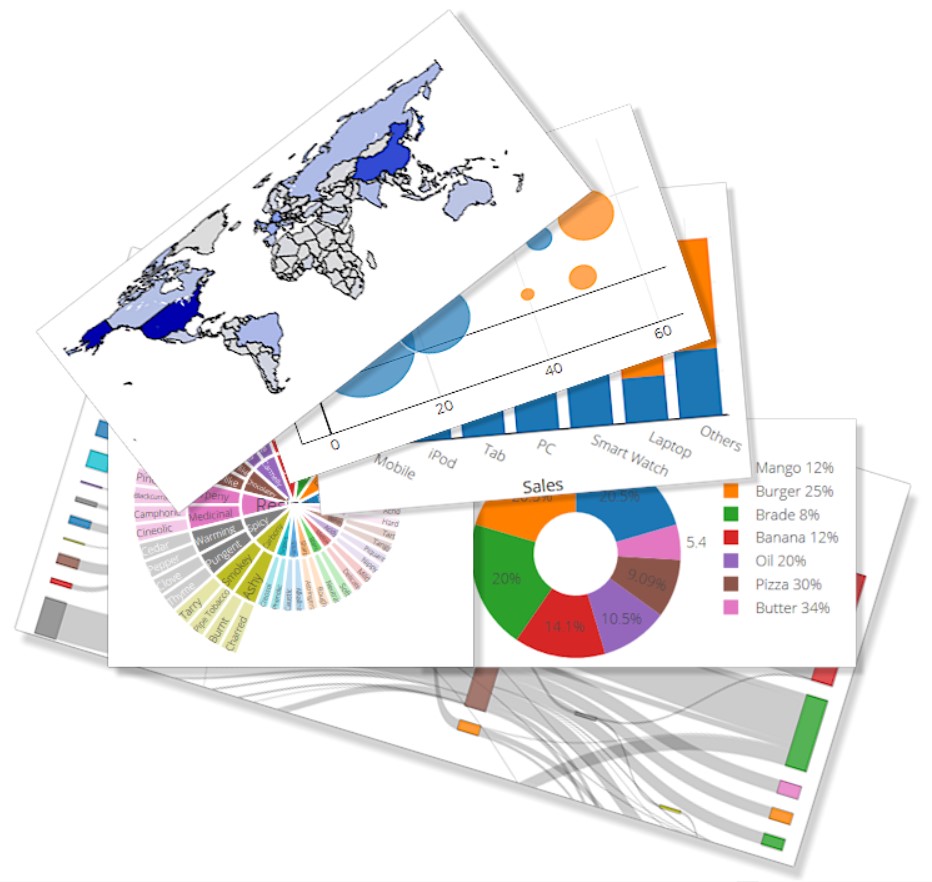
Dashboard Designer enables you to display multiple charts simultaneously on a single canvas, and provides you with a wide range of chart types to choose from, including 3D, Line, Scatter, Bar, Pie, Donut, Bubble, Stack, Area, Heat Map, Sankey Diagrams, and Choropleth Map. If you want to learn how to create a Sankey diagram or utilize a Sankey diagram generator, you can find more information online using resources such as Sankey Diagram Designer.
Effortlessly personalize your dashboard with a single click
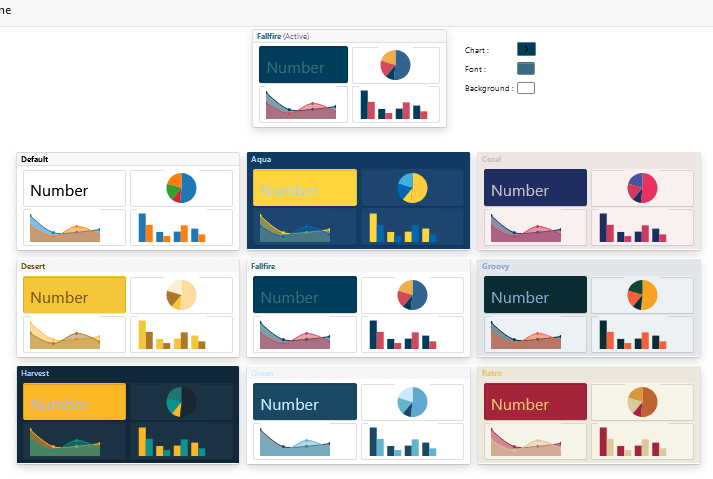
With a single click, you can easily select a distinctive and sophisticated color scheme for your dashboard. All pre-designed themes were created by skilled designers to present data in charts or graphs in a sophisticated and clear manner. Customize the style and feel of your dashboard to reflect your tastes and to create a visually appealing environment that meets your company's needs. Please see this document for further information.

Adapt and visualize data anywhere with Dashboard Designer
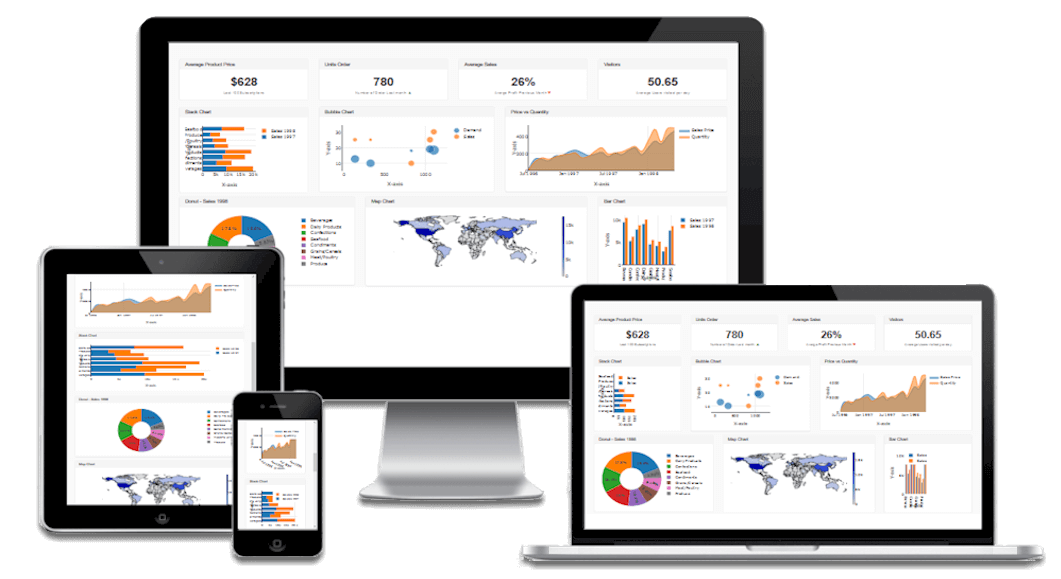
The Dashboard Designer adapts to different screen sizes and device types, providing an optimal viewing experience for the user. It enables the display of data in a visually appealing and user-friendly manner, allowing users to easily analyze and interpret information. Responsive dashboards are becoming increasingly popular in business intelligence and analytics, as they allow decision-makers to access critical data from anywhere, at any time, and on any device. By using the Dashboard Designer's principles, a dashboard can be designed to work seamlessly across various devices and platforms, delivering a consistent experience to all users. This enhances the usability of the dashboard and helps to improve decision-making by providing access to real-time information that is easily accessible and easy to understand.
Dynamic charts that come to life with Dashboard Designer
Dashboard Designer creates dynamic charts based on the D3.js library, which utilizes HTML, CSS, JavaScript, and SVG to generate visualizations of data. These charts can be viewed on any modern browser and will update automatically when clicked or hovered over.
Unleash your dashboard's potential with MIT-licensed source code
Dashboard Designer generates the source code for your dashboard, which can be used in web applications or websites under the MIT license. For comprehensive details about the PHP dashboard code license, please refer to the relevant information provided license here.

Create stunning dashboards for FREE with Dashboard Designer
Dashboard Designer provides free and paid plans, including on-premise and online versions, as well as a free trial and downloadable free dashboard tool. The PRO and Premium licenses offer 100% source code and the dashboard can be integrated with enterprise systems, data analytics, data science, data warehouse, Laravel, Joomla, WordPress, or Drupal websites. These solutions can improve your business or be incorporated into your web applications or software. All Dashboard Designer editions remain fully functional, available for purchase, and come with comprehensive support for users and developers..
