An introduction to the Dashboard Designer – FREE Download
The Dashboard Designer is a versatile tool that empowers users to create visually appealing and interactive dashboards.In today's fast-paced business environment, data visualization has become a crucial aspect of decision-making. Organizations across industries are leveraging the power of dashboards to gain insights and monitor key metrics effectively. In this article, we will explore the features and functionalities of the Dashboard Designer, and discuss how it can be utilized to build impactful dashboards for web applications.
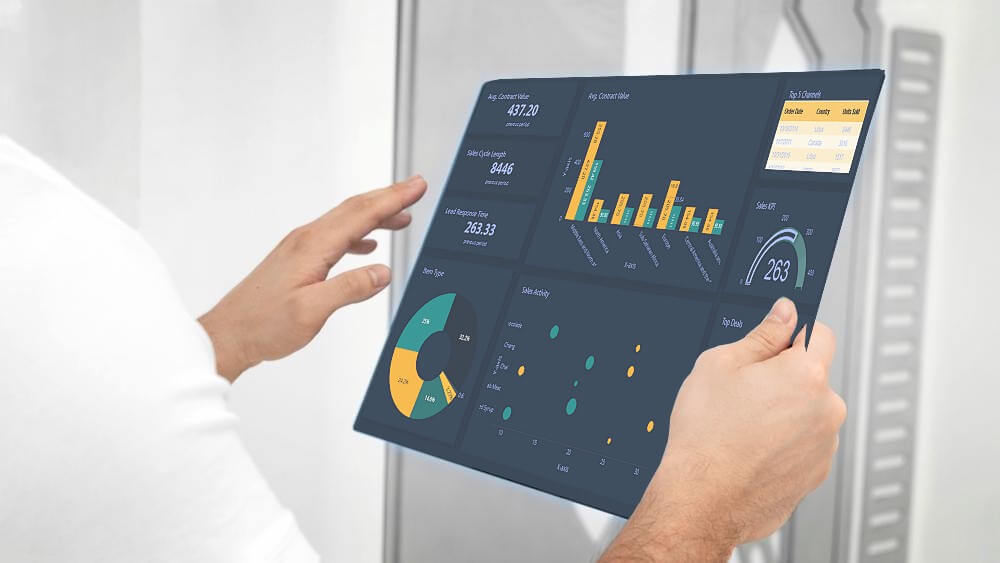
Understanding the Dashboard Designer
The Dashboard Designer is a powerful tool that allows users to create and customize dashboards according to their specific requirements. It offers the Web Dashboard Designer. Let's take a closer look at this feature.
Transforming Data into Actionable Web Dashboard with the Dashboard Designer
The Dashboard Designer is a powerful tool that allows users to create dashboards directly in a web browser. With its browser-based interface, the Dashboard Designer provides a convenient and accessible solution for designing dashboards on the go. To get started with the Dashboard Designer, you can refer to the "How to use the Dashboard Designer" section in this article, which provides a comprehensive guide on creating a web-based dashboard application.
Once you have set up the Web Dashboard Designer, you can explore its various features and customize the dashboard control. The "Web Dashboard" documentation offers insights on how to prepare and customize the Web Dashboard control. Additionally, this article provides step-by-step instructions on designing dashboards in the Web Dashboard Designer.
Features and Functionalities
The Designer offers a wide range of features and functionalities that enable users to create dynamic and interactive dashboards. Let's explore some of the key features of the Dashboard Designer.
Data Source Connectivity
The Dashboard Designer allows users to connect to various data sources, including databases, spreadsheets, and web services. This flexibility enables users to retrieve real-time data and create dynamic dashboards that reflect the most up-to-date information. The Designer supports a wide range of data connectors, ensuring compatibility with popular data sources.
Drag-and-Drop Interface
The intuitive drag-and-drop interface of the Dashboard Designer makes it easy for users to add and arrange data visualizations on the dashboard canvas. Users can simply drag and drop data elements, such as charts, tables, and gauges, onto the canvas and position them according to their preferences. This user-friendly approach eliminates the need for extensive coding or technical expertise, empowering users to create dashboards with ease.
Visualization Customization
The Dashboard Designer offers extensive customization options for data visualizations. Users can modify the appearance, layout, and behavior of individual elements to create visually stunning dashboards that align with their branding and design preferences. The Designer provides a wide range of customization tools, including color palettes, font styles, and interactive elements, allowing users to create engaging and impactful dashboards.
Interactivity and Drill-Down Capabilities
Dashboards created with the Dashboard Designer can be interactive, enabling users to explore data and gain insights through drill-down capabilities. Users can define interactive elements, such as filters and parameters, to allow end-users to interact with the dashboard and view specific data subsets. This interactivity enhances the user experience and empowers users to extract meaningful insights from the dashboard.
Collaboration and Sharing
The Dashboard Designer facilitates collaboration and sharing by providing options to publish dashboards to various platforms. Users can export dashboards as standalone applications or embed them within existing applications. The Designer also supports sharing dashboards via email or through web-based portals, allowing multiple stakeholders to access and interact with the dashboard simultaneously.
Benefits of Using the Dashboard Designer
The Dashboard Designer offers numerous benefits that make it a valuable tool for organizations looking to leverage data visualization. Let's explore some of the key benefits of using the Dashboard Designer.
1. Enhanced Data Visualization
The Dashboard Designer empowers you to transform raw data into visually stunning and easy-to-understand visualizations. With a wide range of customizable charts, graphs, and widgets at your disposal, you can present complex data in a visually appealing manner. This enhanced data visualization capability enables stakeholders to quickly grasp insights and make informed decisions.
2. Interactive and Real-Time Insights
The Dashboard Designer allows you to create interactive dashboards that enable users to explore data in real-time. With intuitive filtering and drill-down capabilities, users can dive deep into the data and uncover valuable insights. This interactivity fosters a data-driven culture within organizations and empowers users to make informed decisions based on real-time data.
3. Seamless Collaboration
Collaboration is crucial in today's fast-paced business environment. The Dashboard Designer offers seamless collaboration features, allowing multiple users to work on the same dashboard simultaneously. This promotes teamwork, ensures data consistency, and accelerates the dashboard creation process. With the ability to share dashboards easily, you can facilitate effective communication and alignment across teams.
4. Cross-Platform Flexibility
The Dashboard Designer provides cross-platform flexibility. This means you can create dashboards on the platform that best suits your needs and seamlessly transition between platforms if required. This flexibility ensures that you can cater to the diverse needs of your users and leverage the power of data visualization across different devices and operating systems.
5. Extensive Customization Options
Every business has unique requirements when it comes to data visualization. The Dashboard Designer offers extensive customization options, allowing you to tailor the appearance and functionality of your dashboards to align with your brand and specific needs. From color schemes and themes to interactive elements and layout options, the Dashboard Designer enables you to create dashboards that are truly reflective of your organization's identity.
How to Use the Dashboard Designer
APPLIES TO: On-premises Online Desktop
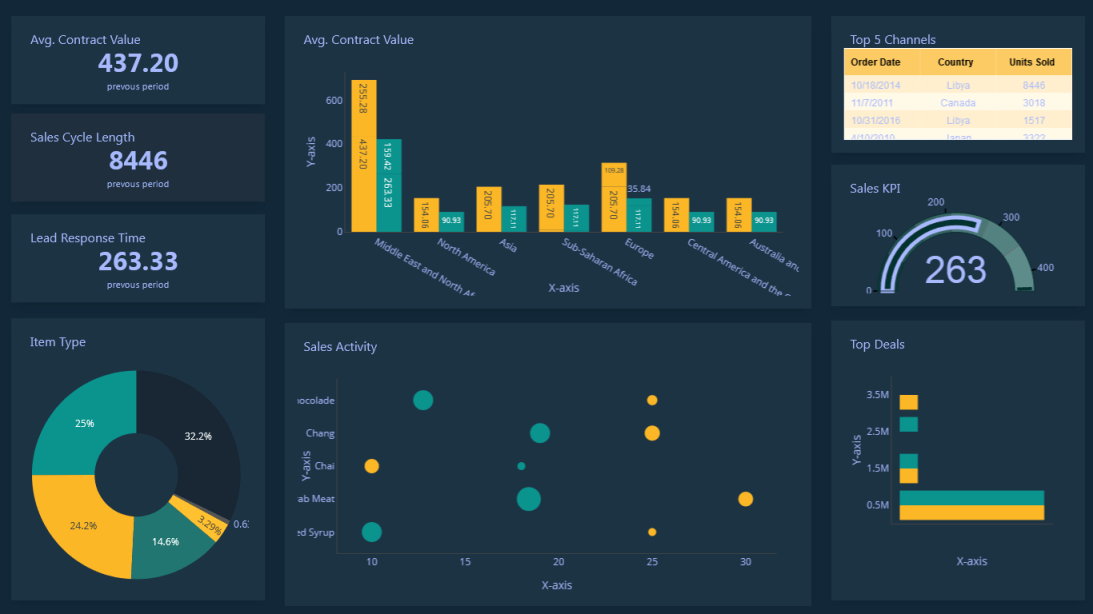
In this article, we'll use the Dashboard Builder Tool to design a dashboard and retrieve data from a PostgreSQL database, as well as generate PHP source code.
Prerequisites
PosgreSQL Dashboard can be installed any platforms like Windows, Linux and Ubuntu or any other platforms support Apache, Nginx etc.
Requirements
- PHP Version 7.2 or later
- Apache 2 or later
- PostgreSQL database
- PDO and pdo_pgsql
- Windows 7 or later /Linux 3 or later
- Firefox 52, Chrome 57, IE
- PostgreSQL Dashboard is available for downloading
Installation
There is a Free version of the Dashboard Designer available for trail bases,
- You can download the Dashboard Designer dashboard code fromDownload Dashboard Designer
- Place the files in a directory on the web server. e.g.
…/www/yoursite/dashbboardbuilder-v3-FREE/ - Unzip
 the file dashboard.zip using Extract Here option to the root folder of "dashboardbuilder"
Steps to build PostgreSQL dashboard
STEP-1: Connect with PostgreSQL Database
- Run the web folder in your browser. e.g. http://localhost/dashboardbuilder following welcome screen will appear.
"database-name" in the DB name field and click Save changes button.
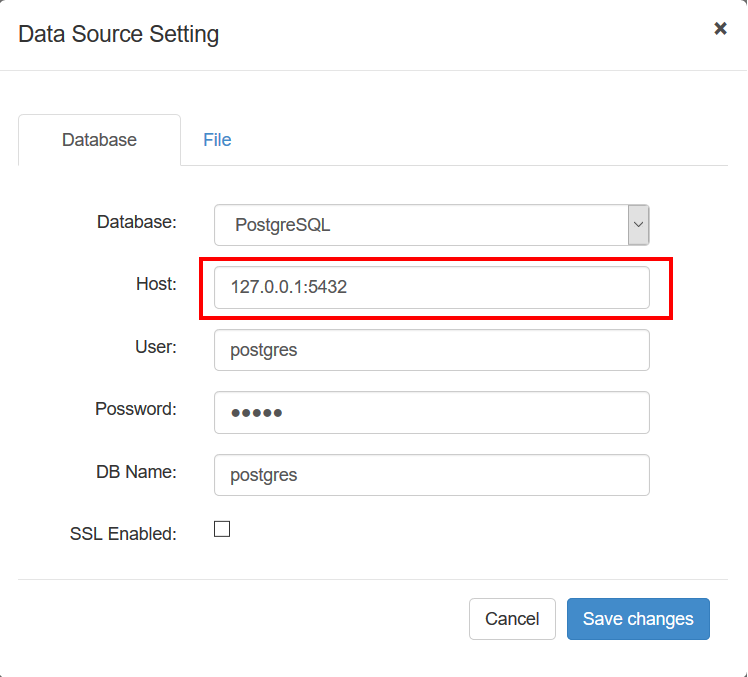
Tip: If your database is not in the public schema, then you can use your schema name in this manner 127.0.0.1:5432/Schema in the host field.
- When you click the save changes, a green tick mark with Database will appear that shows that your database is successfully connected.
Tip: To retrive data from PostgreSQL database, PDO driver 'pdo_pgsql' must be installed. For more details please have a look at our Documentation
STEP-2: Chart settings
- After successfully connect to your PostgreSQL database, we will retrieve data from your database in our next step.
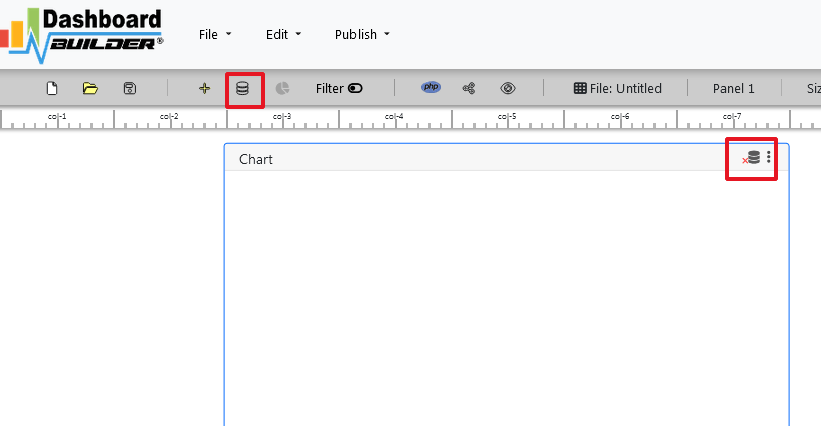
- Select the gear icon.
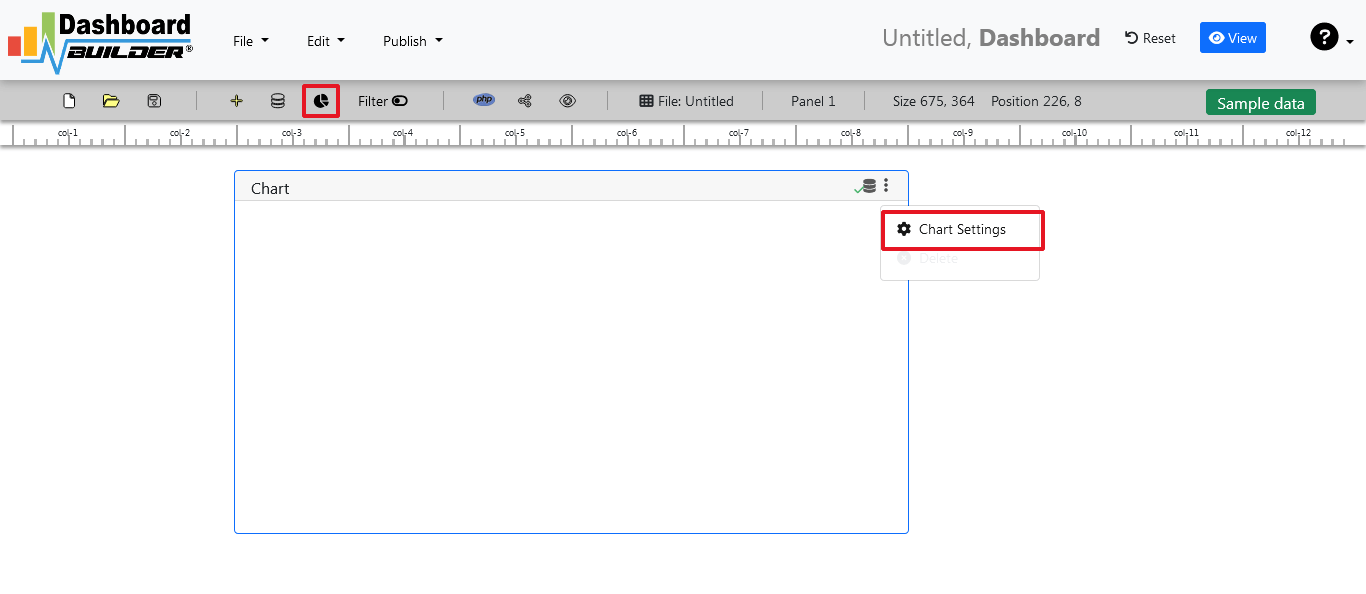
- A pop-up screen will appear and a list of the tables from your PostgreSQL database will appear on the table list as shown in the picture below.

PostgreSQL dashboards have a powerful Query Builder, a smart SQL statement builder tool for quick and easy writing of complex SQL queries without manual code writing which is designed to simplify the retrieving of data from the database.
- When you click on the table, a default SQL statement will appear on the SQL statement box, which you may modify as per your need.
- You can add up to 10 SQL statements simultaneously to retrieve data from different tables.
STEP-3: pgSQL statements
- In our example, we will be creating a simple PHP application for our sales management. This PHP dashboard will contain a chart where users can find the sales stats and maintain the data about the products.
- Now, enter the pgSQL statement in text box in a following manner
SELECT strftime('%Y-%m',o.shippeddate) as xaxis, sum(d.quantity) as yaxis from `order details` d, orders o where o.orderid = d.orderid group by strftime('%Y-%m',o.orderdate) limit 50
- Now, we want to execute our query and fetch the data from the tables. Click the Run Query button

- Query Result will appear. Now, we have to assign x-axis data to the x-axis column and y-axis data to the y-axis column. Select your x-axis data from the drop down list of X and y-axis data from the drop down list of Y .
- Click Save Changes
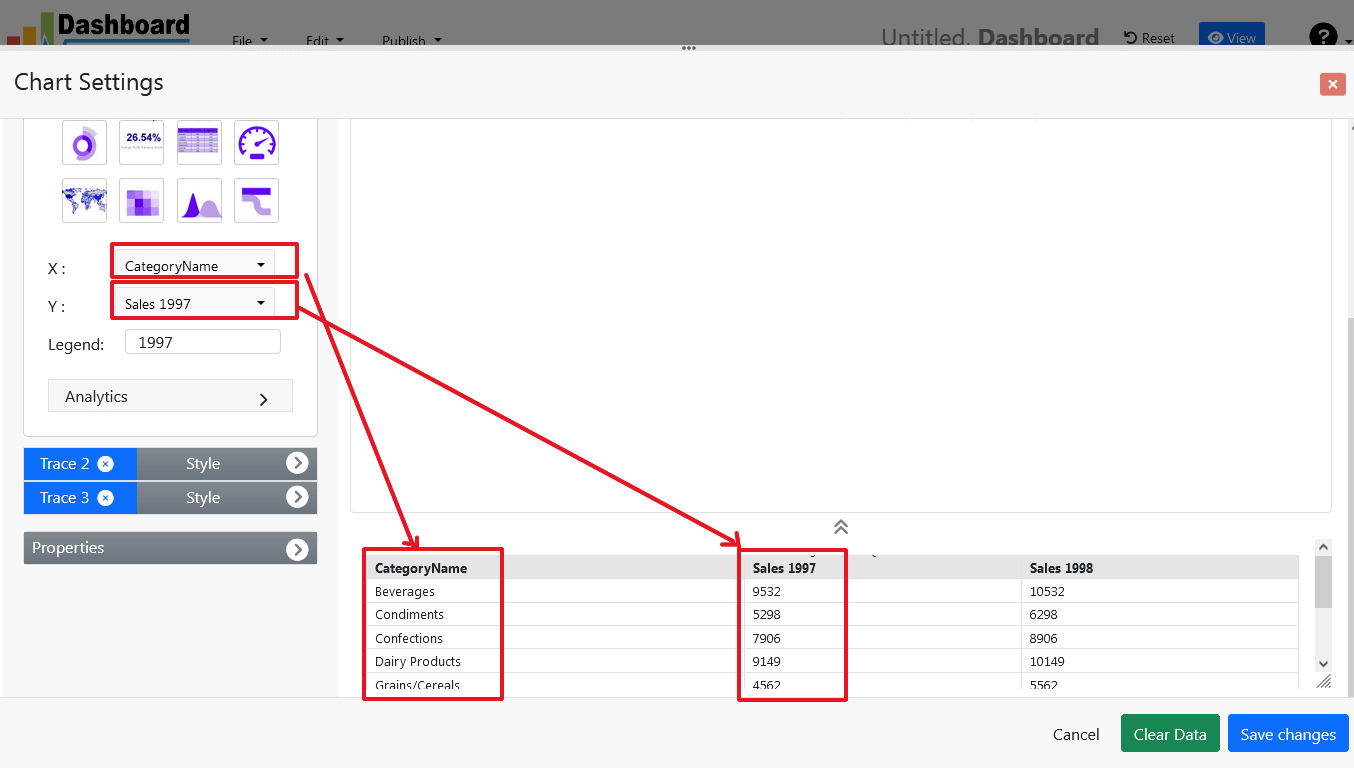
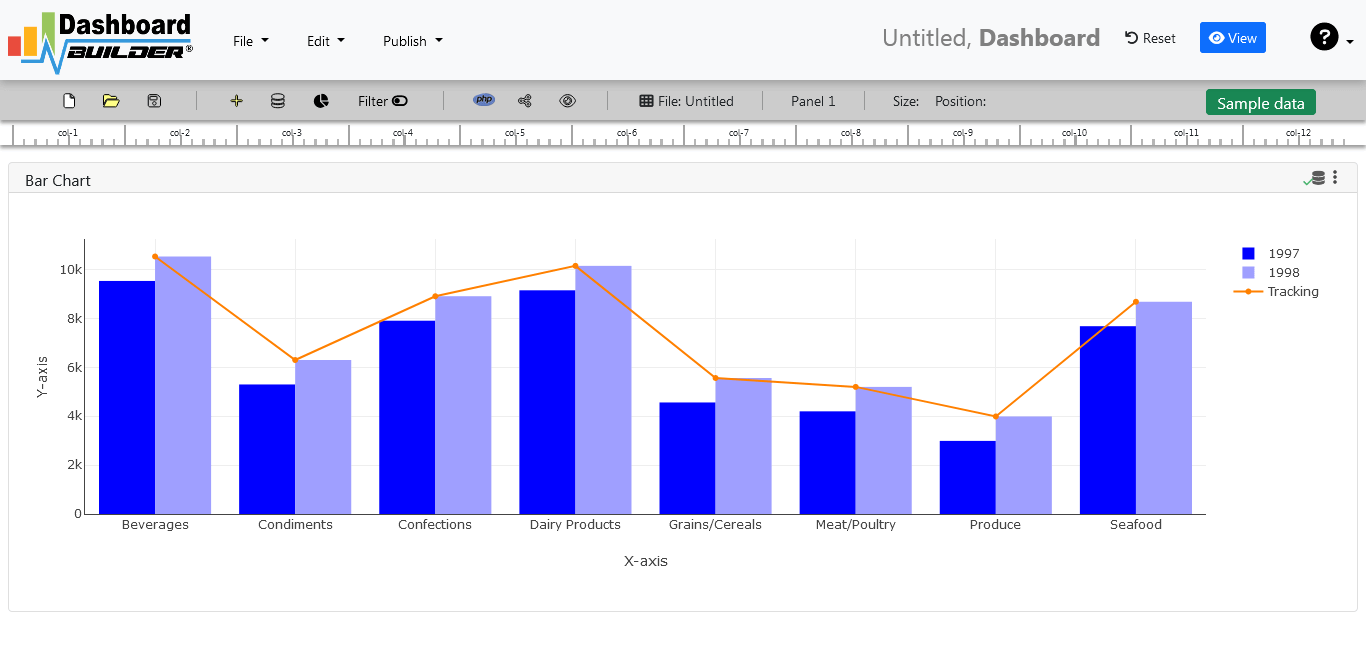
- Charts will be appeared on the screen as shown below.
STEP-4: Adjust the position
- You may adjust the size and the position of the Chart Panel by dragging its corner. The size and position are fully responsive according to the Bootstrap framework
STEP-5: Generate source code of the Dashboard for your Web Application
- So far we have successfully build our dashboard. In this step we are going to generate the source code we have just created. Click the Generate button to auto-generate PostgreSQL dashboard source code for our PHP application

- The source code for the dashboard will automatically generate, you may copy past this script of dashboard to your PHP application.
Open Source Code of the Dashboard Designer for Web Application
/**
 * DashboardBuilder
 *
 * @author Diginix Technologies www.diginixtech.com
 * Support  - http://www.dashboardbuilder.net
 * @copyright (C) 2018 Dashboardbuilder.net
 * @version 2.1.7
 * @license: license.txt
 */

include("inc/dashboard_dist.php");  // copy this file to inc folder


// for chart #1
$data = new dashboardbuilder();
$data->type =  "line";

$data->source =  "Database";
$data->rdbms =  "pgsql";
$data->servername =  "your-servername";
$data->username =  "userid";
$data->password =  "password";
$data->dbname =  "your-db-name";
$data->xaxisSQL[0]=  "SELECT strftime(^%Y-%m^,o.shippeddate) as xaxis, sum(d.quantity) as yaxis from `order details` d, orders o  where o.orderid = d.orderid group by strftime(^%Y-%m^,o.orderdate) limit 50";
$data->xaxisCol[0]=  "xaxis";
$data->yaxisSQL[0]=  "SELECT strftime(^%Y-%m^,o.shippeddate) as xaxis, sum(d.quantity) as yaxis from `order details` d, orders o  where o.orderid = d.orderid group by strftime(^%Y-%m^,o.orderdate) limit 50";
$data->yaxisCol[0]=  "yaxis";
$data->name = "linechart";
$data->title = "Line Chart";
$data->orientation = "";
$data->xaxistitle = "x-axis title";
$data->yaxistitle = "y-axis title";
$result[0] = $data->result();

?>

<!DOCTYPE html>
<html>
<head>
	<script src="assets/js/dashboard.min.js"></script> <!-- copy this file to assets/js folder -->
	<!--<link rel="stylesheet" href="assets/css/bootstrap.min.css"> Bootstrap CSS file, change the path accordingly -->


</head>
<body>

<div class="container">
<div class="col-lg-12">
<div class="panel panel-default">
<div class="panel-heading"></div>
    <div class="panel-body">
        <?php echo $result[0];?>
    </div>
</div>
</div>
</div>
</body>
Conclusion
In conclusion, the Dashboard Designer is a powerful tool that unlocks the potential of data visualization and analysis. This versatile tool empowers you to create visually stunning, interactive, and highly customizable dashboards. By leveraging the capabilities and resources available with the Dashboard Designer, you can transform raw data into valuable insights, foster a data-driven culture, and make informed decisions that drive business growth. Embrace the power of the Dashboard Designer and unleash the potential of data visualization in your organization.
 the file dashboard.zip using Extract Here option to the root folder of "dashboardbuilder"