Dashboard Software FREE Download | Best Tools for Data Visualization & Analytics
Dashboard software is a digital tool that enables users to create, customize, and interact with visual representations of data, usually in the form of charts, graphs, and other visual elements. These dashboards provide a consolidated view of data, making it easier for individuals and teams to monitor key performance indicators (KPIs), track progress, and make informed decisions. Dashboard software often connects to various data sources, including databases, spreadsheets, APIs, and cloud services, to aggregate and dashboard display data in real-time or at scheduled intervals.
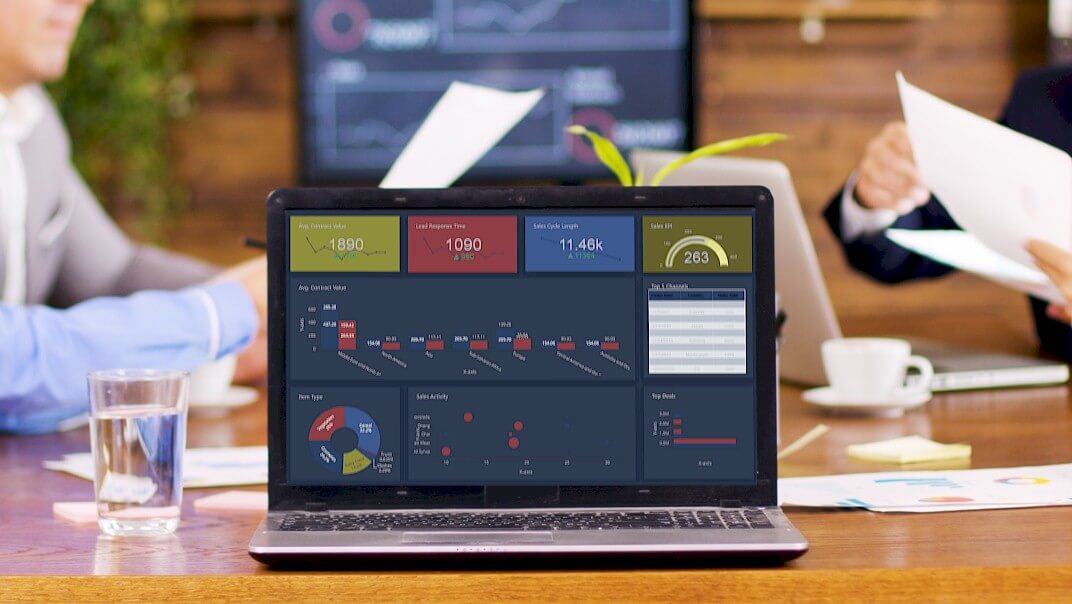
What is Dashboard Software?
Dashboard software is a game-changer in today's data-driven world. Businesses and organizations collect massive amounts of data on a daily basis. They require effective tools to visualize and analyze data in order to make informed decisions and gain insights. In this regard, dashboard-software plays a vital role. It enables users to turn raw data into meaningful, actionable insights, resulting in improved decision-making and overall efficiency. In this blog, we'll look at what dashboard software is, its key features, benefits, popular use cases, and important factors to consider when choosing the right solution.
Best Dashboard Software
Dashboard Software Features
- Data Visualization: Dashboard software offers a wide range of visualization options, such as bar charts, pie charts, line graphs, heatmaps, and more. Users can choose the most suitable visual representation for their data.
- Real-Time Data: Many dashboard tools allow users to connect to live data sources, ensuring that the displayed information is always up-to-date.
- Customization: Users can personalize their dashboards by selecting color schemes, adding logos, and arranging widgets to suit their preferences and branding.
- Interactivity: Interactivity is a crucial feature. Users can click on elements in the dashboard to filter data or drill down into more detailed information.
- Data Integration: The ability to connect to various data sources, including databases, spreadsheets, cloud applications, and web services, is essential for comprehensive data analysis.
- Alerts and Notifications: Many dashboard solutions offer the capability to set up alerts based on predefined conditions, helping users stay informed when specific thresholds are met or exceeded.
- Mobile Responsiveness: Dashboards should be accessible on mobile devices, ensuring that users can access critical information on the go.
- Security and Access Control: Robust security features are necessary to protect sensitive data. Role-based access control allows administrators to define who can view and edit specific dashboards.
Benefits of Dashboard Software
- Improved Decision-Making: Dashboards provide a clear and concise view of data, enabling faster, data-driven decision-making.
- Efficiency: By consolidating data from various sources, dashboard software saves time and effort in data gathering and analysis.
- Visibility: Dashboards offer transparency, allowing teams to monitor progress and performance in real-time.
- Productivity: With data readily available, teams can focus on tasks that matter most, rather than sifting through data manually.
- Early Issue Detection: Real-time data and alerts help in identifying issues or opportunities as soon as they arise.
- Enhanced Collaboration: Dashboards can be shared with team members, fostering collaboration and alignment around common goals.
Popular Use Cases for Dashboard Software
- Business Analytics: Companies use dashboards to track financial metrics, sales performance, customer satisfaction, and operational efficiency.
- Marketing Metrics: Marketers use dashboards to monitor website traffic, conversion rates, social media engagement, and email campaign performance.
- IT Operations: IT teams can create dashboards to monitor server uptime, network performance, and security threats.
- Healthcare: Hospitals and medical facilities utilize dashboards to monitor patient data, resource allocation, and emergency room occupancy.
- Education: Educational institutions use dashboards to track student progress, attendance, and resource utilization.
- Finance and Investments: Investors use dashboard-software to monitor stock portfolios, track market trends, and analyze investment data.
Considerations for Selecting Dashboard Software
- Data Sources: Ensure the software supports data sources relevant to your organization.
- Ease of Use: Choose a tool that is user-friendly, as complex software may hinder adoption.
- Scalability: Select a solution that can grow with your business and accommodate increasing data volume.
- Cost: Consider your budget and pricing model, whether it's a one-time purchase, subscription-based, or open source.
- Integration: Ensure the software can integrate with your existing systems and applications.
- Security: Evaluate the security features, including data encryption, user access control, and compliance with data protection regulations.
- Support and Training: Assess the availability of support and training resources to help your team get the most out of the software.
- Customization: Look for a tool that allows you to customize dashboards to meet your specific needs.
What software is used for dashboards?
There are numerous software options available for creating dashboards, catering to a wide range of users, from individuals to large enterprises. The choice of dashboard display software depends on your specific needs, budget, and technical expertise.
When selecting dashboard software, consider factors such as your data sources, the level of customization required, user-friendliness, scalability, and budget. Many of these tools offer dashboard software free trials or free versions, which can help you determine which one best suits your needs before making a commitment.
Which tool is best for dashboard?
Determining the "best" dashboard tool depends on your specific requirements, such as your data sources, level of technical expertise, budget, and the complexity of your dashboard projects. The Dashboard Builder is the only dashboard software that one-size-fits-all answer, and that works best for all and the ideal choice for organizations.
Best Dashboard Software: Why Dashboard Builder Stands Out
In the ever-evolving world of data analytics, choosing the best dashboard software is critical for businesses seeking actionable insights. While numerous dashboard solutions exist, Dashboard Builder stands out as an industry-leading tool due to its powerful features, user-friendly interface, and seamless data integration capabilities.
Why Choose Dashboard Builder?
1. User-Friendly & No-Code Approach
Unlike many dashboard tools that require advanced technical skills, Dashboard Builder is designed for all users—whether you’re a data analyst, a business manager, or an IT professional. With its intuitive drag-and-drop interface, users can create dynamic dashboards without any coding knowledge.
2. Real-Time Data Analytics
Businesses rely on real-time data to make informed decisions. Dashboard Builder connects with multiple data sources, including databases, spreadsheets, APIs, and cloud services, ensuring that your dashboards always reflect the latest data updates.
3. Advanced Data Visualization
Dashboard Builder provides a comprehensive suite of visualization options, including bar charts, pie charts, line graphs, heatmaps, and KPI widgets. These elements allow users to present data in the most effective and engaging way.
4. Customization & Branding
One of the biggest advantages of Dashboard Builder is its high level of customization. Users can personalize dashboards by adding company logos, choosing color themes, and adjusting layouts to align with their brand identity.
5. Interactivity & Drill-Through Features
Unlike static reports, Dashboard Builder allows users to interact with data through filters, drill-downs, and dynamic widgets. This means businesses can explore data at different levels—whether it's a high-level overview or detailed granular analysis.
6. Security & Role-Based Access Control
Security is a top priority when dealing with sensitive business data. Dashboard Builder offers robust role-based access control (RBAC), ensuring that only authorized users can view or modify specific dashboards. This feature is essential for enterprises handling confidential information.
7. Seamless Integration with AI & ChatGPT
What sets Dashboard Builder apart from competitors is its integration with AI and ChatGPT. Users can leverage AI-powered insights, automate reports, and even interact with their data using natural language queries—transforming traditional dashboarding into an intelligent analytics platform.
8. Scalability & Cloud Deployment
Whether you’re a startup, a mid-sized business, or a large enterprise, Dashboard Builder scales with your needs. It supports cloud-based deployment, allowing remote teams to collaborate efficiently while accessing real-time data from anywhere.
9. Cost-Effective & Free Version Available
Many dashboard solutions come with hefty licensing fees. Dashboard Builder offers a free version, making it an ideal choice for startups, educators, and small businesses looking to get started with data analytics without a significant upfront investment.
When it comes to the best dashboard software, Dashboard Builder is a clear winner. Its ease of use, powerful visualization capabilities, real-time analytics, AI integration, and affordability make it an essential tool for organizations looking to harness the power of data. Whether you need business intelligence, marketing analytics, IT monitoring, or financial reporting, Dashboard Builder is the ultimate solution for turning raw data into meaningful insights.
How can I create my own dashboard?
APPLIES TO: On-premises Online Desktop
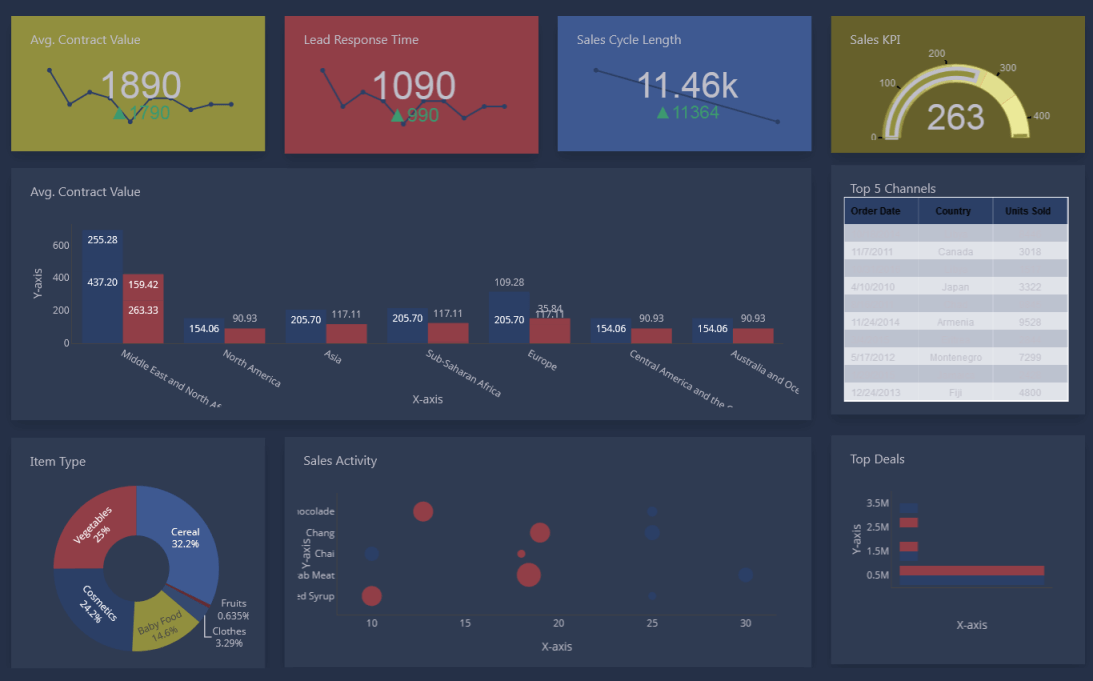
Creating dashboard software is a significant undertaking, and the complexity of the project may vary based on your specific goals and resources. It's essential to continuously gather feedback from users and iterate on your software to meet evolving needs and expectations. Additionally, consider open-source development, as building a community around your software can be valuable in terms of contributions, support, and adoption.
Creating a dashboard software using a dashboard builder is a more streamlined and user-friendly process compared to building it from scratch. Dashboard builder is a software tool that provides a user interface for creating dashboards with pre-built components and templates. Here's a step-by-step guide on how to create a dashboard using a dashboard builder:
Requirements:
- PHP Version 7.2 or later
- Apache 2 or later
- Windows 7 or later / Linux 3 or later
- Compatible browsers: Firefox 52, Chrome 57, IE 8
Installation:
- Download the Dashboard Builder from the provided source.
- Place the downloaded file in a directory on your web server (e.g., .../www/dashboardbuilder/).
- Unzip the downloaded zip file into the root folder of "dashboardbuilder."
Step 1: Connect to the MySQL Database
- Open your web folder in the browser at "http://localhost/dashboardbuilder."
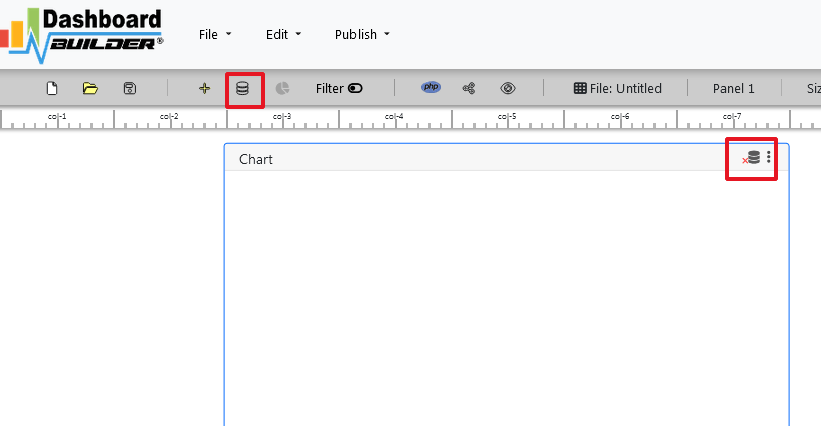
- Click on the Database icon in the Dashboard Software welcome screen.
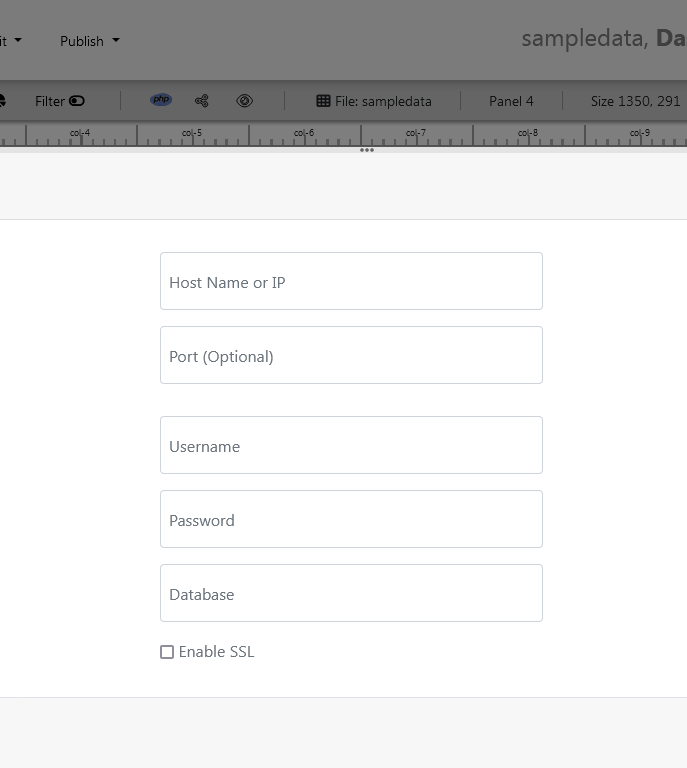
- Select the MySQL database as the data source.
- Enter the database credentials.
- Save the changes.
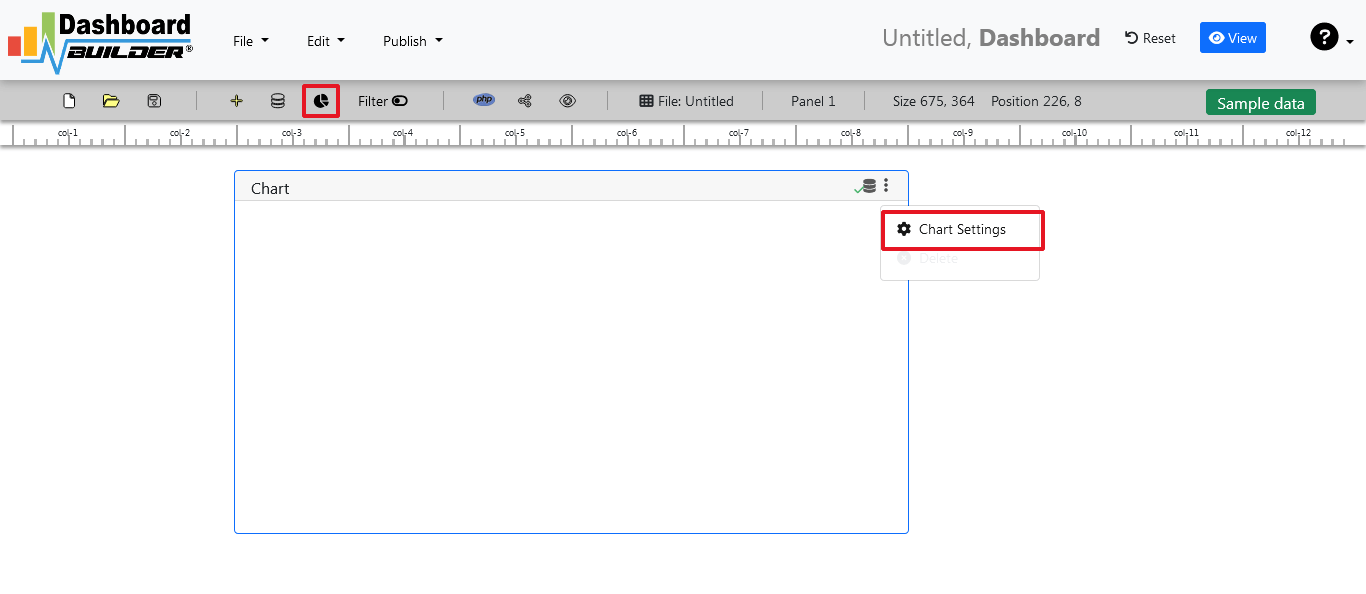
Step 2: Launch the Chart Settings Panel
- After successfully connecting to the database, select the chart settings option.
Step-3: Retrieve data from the database

- A list of tables will appear. Click on a table to select it.
- A default SQL statement will be shown, which you can modify as needed.
- You can use up to ten SQL statements simultaneously.
- Enter an SQL query for your dashboard. For example, you can use this SQL query:
- Click the "Run Query" button to execute the SQL query.
SELECT strftime('%Y-%m',o.shippeddate) as xaxis, sum(d.quantity) as yaxis from `order details` d, orders o where o.orderid = d.orderid group by strftime('%Y-%m',o.orderdate) limit 50
Step 4: Select the X and Y Axes
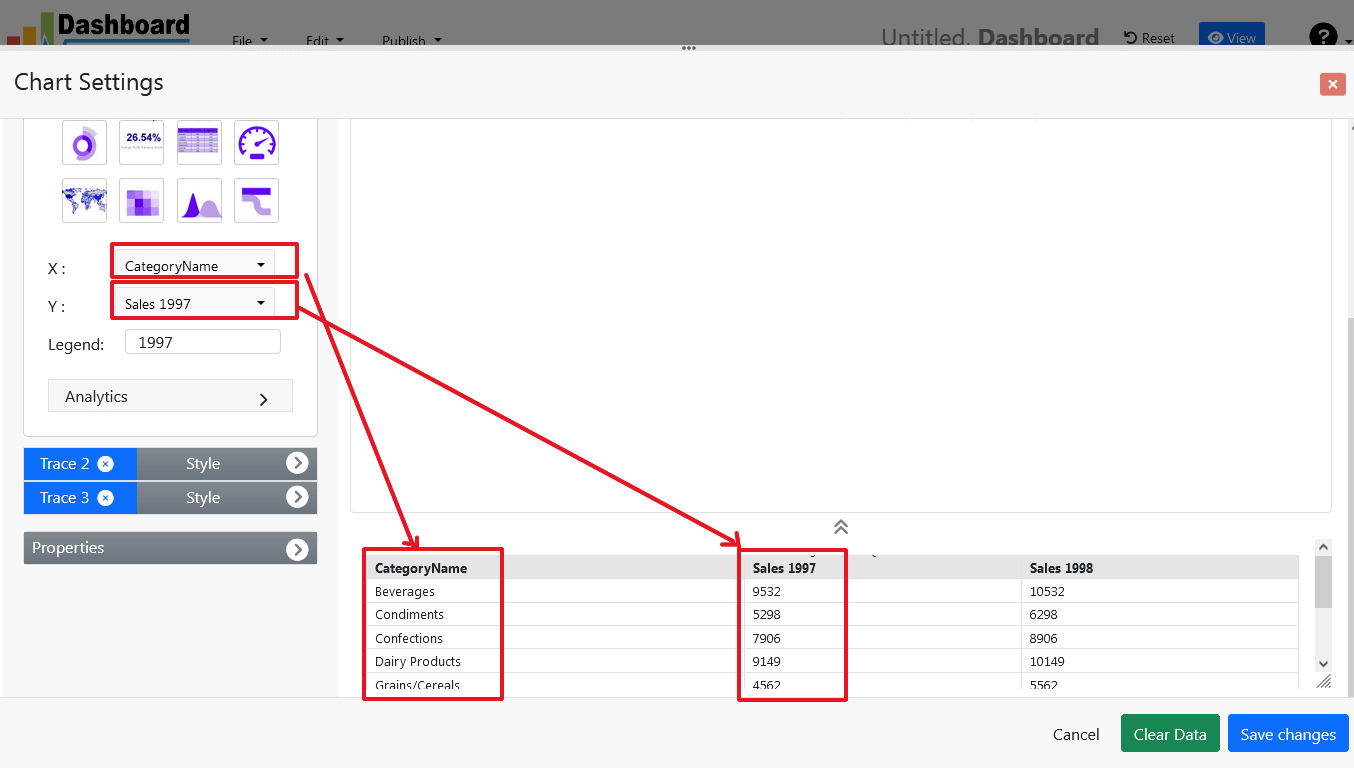
- The query result will be displayed.
- Assign data from the x-axis to the x-axis column and data from the y-axis to the y-axis column.
- Choose your x-axis data from the X dropdown list and your y-axis data from the Y dropdown list.
- Click the "Save Changes" button.
Step 5: Generate PHP Source Code for your Dashboard Software

- To generate the PHP dashboard source code for your dashboard software, click the "Create PHP code" button.
- The dashboard software source code for the dashboard will be automatically generated.
- Copy and paste this dashboard software script into your web application.
/**
 * DashboardBuilder
 *
 * @author Diginix Technologies www.diginixtech.com
 * Support  - http://www.dashboardbuilder.net
 * @copyright (C) 2018 Dashboardbuilder.net
 * @version 2.1.7
 * @license: license.txt
 */

include("inc/dashboard_dist.php");  // copy this file to inc folder


// for chart #1
$data = new dashboardbuilder();
$data->type =  "pie";

$data->source =  "Database";
$data->rdbms =  "mysql";
$data->servername =  "";
$data->username =  "";
$data->password =  "";
$data->dbname =  "northwind";
$data->xaxisSQL[0]=  "SELECT strftime(^%Y-%m^,o.shippeddate) as xaxis, sum(d.quantity) as yaxis from `order details` d, orders o  where o.orderid = d.orderid group by strftime(^%Y-%m^,o.orderdate) limit 50";
$data->xaxisCol[0]=  "xaxis";
$data->yaxisSQL[0]=  "SELECT strftime(^%Y-%m^,o.shippeddate) as xaxis, sum(d.quantity) as yaxis from `order details` d, orders o  where o.orderid = d.orderid group by strftime(^%Y-%m^,o.orderdate) limit 50";
$data->yaxisCol[0]=  "yaxis";
$data->name = "piechart";
$data->title = "Pie Chart";
$data->orientation = "";
$data->xaxistitle = "x-axis title";
$data->yaxistitle = "y-axis title";
$result[0] = $data->result();

?>

<!DOCTYPE html>
<html>
<head>
	<script src="assets/js/dashboard.min.js"></script> <!-- copy this file to assets/js folder -->
	<!--<link rel="stylesheet" href="assets/css/bootstrap.min.css"> Bootstrap CSS file, change the path accordingly -->


</head>
<body>

<div class="container">
<div class="col-lg-12">
<div class="panel panel-default">
<div class="panel-heading"></div>
    <div class="panel-body">
        <?php echo $result[0];?>
    </div>
</div>
</div>
</div>
</body>
The provided instructions walk you through creating a dynamic dashboard software in PHP with a MySQL database connection. It's essential to have some knowledge of SQL queries and PHP development to follow these steps effectively. This process allows you to create a customized dashboard that retrieves and displays data from your database, making it a valuable tool for data analysis and visualization.
Conclusion
Dashboard software is a powerful tool for businesses and organizations seeking to gain insights from their data. By providing a visual, real-time view of key metrics and performance indicators, dashboard software streamlines decision-making, enhances efficiency, and fosters collaboration. Selecting the right dashboard software requires careful consideration of features, use cases, and integration capabilities. With the right solution in place, you can unlock the full potential of your data and drive success in today's data-driven world.