Chart Builder overview
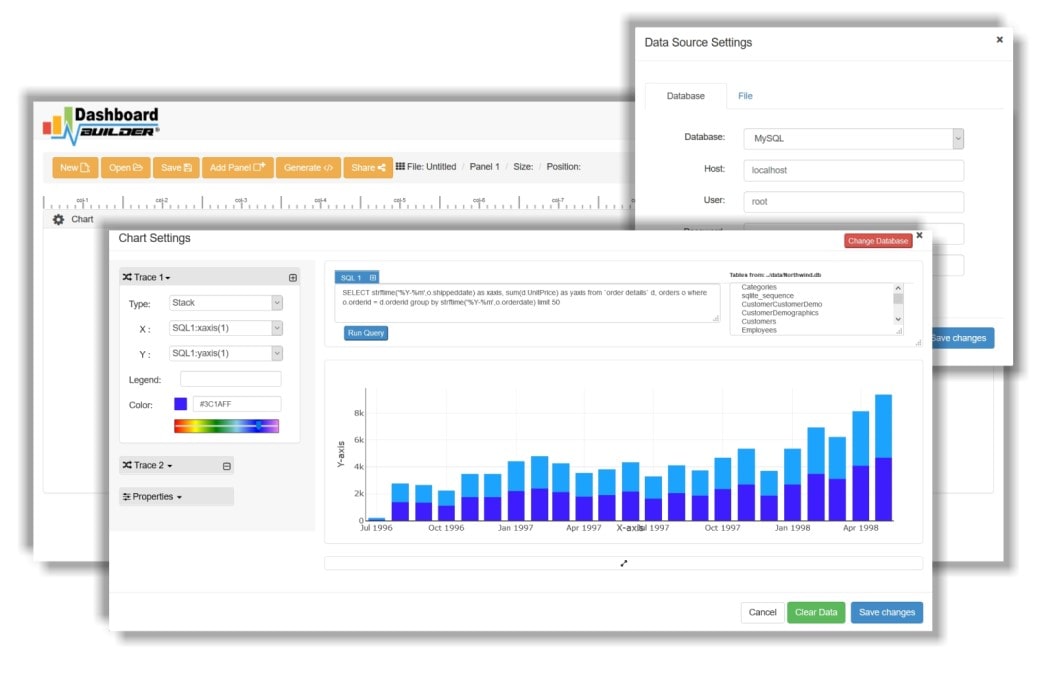
CHART BUILDER is a front-end, powerful charting tool that visualizes your data and builds beautiful charts for your business. Chart Builder is a fully-featured with a browser-based, drag-and-drop utility which has a powerful built-in SQL code generator, hence does not require any technical resource or programming skill and reduce your time to retrieve complex data from a numerous data source, streamlines complex data query and gives a quick insight of business metrics in a graphical layout.
Chart Builder has a built-in powerful PHP MySQL chart generator tool with auto-generated SQL queries. In addition, it allows you to write your custom SQL queries to put your data to start bringing your data to life. Not only this, but Chart Builder also allows you to retrieve data from MS Excel, JSON, CSV files, and Google Sheet.

Visualize hightech chart with this great Chart Builder tool.
Chart Builder has a unique type of drag & drop web interface for SQL code generator that lets you retrieve data from a database and generate chart in minutes and without coding. It has a powerful chart builder insight which is the easiest way of chart generator for any database supported in the PDO library.
Chart Builder supports a huge number of charts and can be used to create either static or real-time charts with data coming from a variety of sources such as MySQL, MS SQL, SQLite, PostgreSQL, Sybase and Cubrid with no programming skills required. The fascinating thing is that as a part of the community.
Rather than fiddling around with various settings, Chart Builder has simple drag-and-drop UI, which allows you to reposition and resize your chart with ease. Chart Builder generates PHP code in just one click for your application and embeds the code anywhere in your application you want. Chart Builder is designed to integrate with a PHP application you may already be using.
Chart Builder is lightweight
Chart builder is a lightweight utility, it is built in a simplistic and prescriptive way. Hence, it does not need lavish requirements to run.
Requirements:
- PHP Version 7.2 or later
- Apache or Nginx
- Windows, Linux or Ubuntu
Chart builder runs on all SVG-compatible browsers such as:
- Firefox 52 or higher.
- Chrome 57 or higher
- IE 8 or higher
In order to connect to your database and retrieve data for your charts, you have to make sure that your Web Server (like Apache, Nginx, etc) is configured to display it's folder which will contain the dashboard. Read-Write permission to the folders and sub-folders of dashboardbuilder i.e chmod -R 777 dashbboardbuilder-v3-FREE. Just check your browser inspector/console to make sure that there isn't any error being reported, and all the Chart Builder tool files are being loaded properly.
How to make a chart and graph?
Chart Builder is a browser-based, written in PHP, JavaScript, and HTML. It requires Apache server, the largest open source community for the server-side script, available in almost all famous operating systems such as Windows, Linux, Ubuntu or any other platforms which support Apache.
Chart Builder uses Bootstrap CSS framework, D3.js library, and HTML5, which displays responsive and dynamic charts for your database.
The following 3 easy steps are instructive in many ways to help you to retrieve your data from a data source and create a chart.
- Connect to your database
- Retrieve data using the powerful SQL generator.
- Assign data to X and Y axis column
1. Connect to your database
Chart Builder has an attractive user interface, in which you may provide your database credentials to connect your database. Chart Builder uses SSL to send and receive data over the internet without compromising the security of your credentials.
2. Retrieve data using the powerful SQL generator.
Chart Builder has a powerful built-in SQL builder, which connects to your database and generates SQL statements automatically in a few clicks and retrieves the data using innovative high-tech technology.
3. Assign data to X and Y-axis column
Once the data is retrieved, you may easily assign the columns in the X and Y-axis to display your desired chart. Chart Builder has a powerful drag and drops feature with the state of art, in which you can resize and place your chart according to your needs.
Publish and share your charts with One Click
Publish and share your charts with those around you using just one click. this PHP charting tool has the ability to publish your PHP chart in just one click. the PHP chart generator generate a URL for the PHP charts you want to share with your colleagues.
Not only this, Chart builder has PHP chart generator built-in, which generates PHP source code for your PHP chart in one click. This auto-generated code PHP chart is published under MIT license, which you may customize as per your desire needs and can be used or embed in your PHP application.
Chart Builder Example
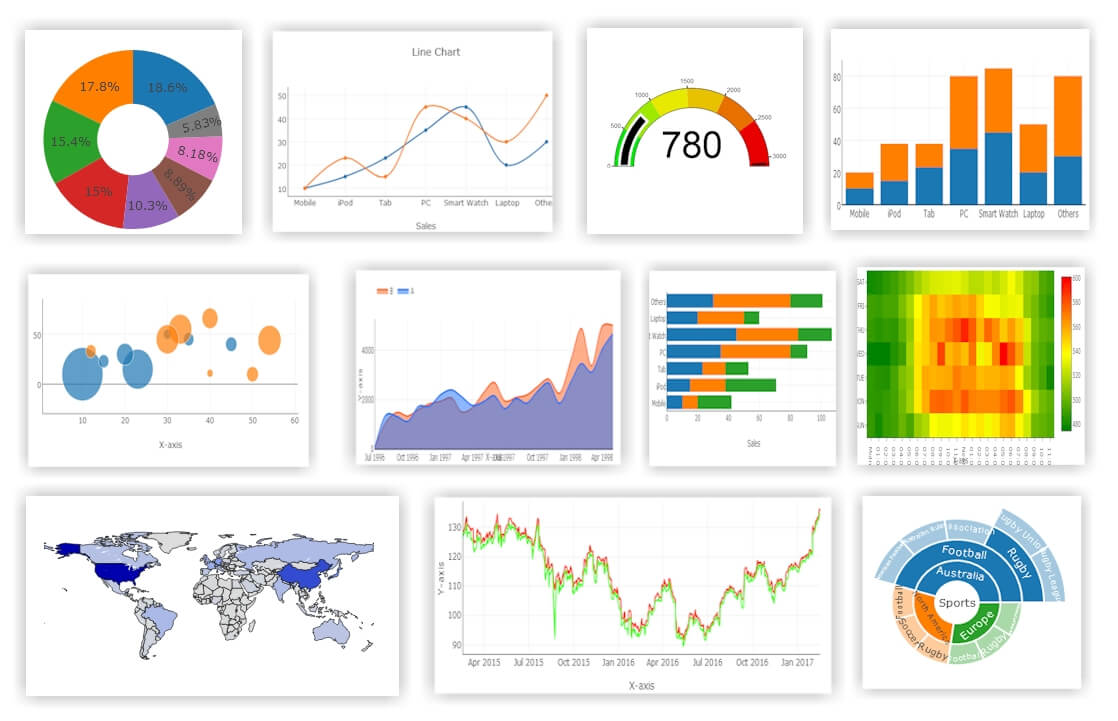
Follwoing is the example of the most popular and most widely used charts supported in the Chart Builder.
11 famous charts type supported in Chart Builder
Chart Builder is comprised of a huge range of famous charts. You may select a different chart type from the given drop-down list of the chart.
Chart Builder brings all famous charts together in one place to trace and measure your business performance on each different measurement. However, the following are the 11 most popular chart types available in chart builder:

- Line Chart
- Bar Chart
- Stacked Bar Chart
- Scatter Chart
- Area Chart
- Donuts Chart
- Bubble Chart
- Gauge
- Heatmap
- Choropleth map
- Sunburst Chart
1. Line Chart
Creating a line chart in Chart Builder is so easy. A line chart presents details as a series of data points connected by a straight line. It is a basic type of chart, most common and widely used in many fields.
2. Bar Chart
Create your fantastic colorful bar chart using Chart Builder in minutes. A bar chart displays categorical data with rectangular in heights or lengths proportional to the values that they represent. The data is plotted in bar charts either vertically or horizontally.
3. Stacked Chart
Chart Builder supports stacked bar chart. A stacked bar chart is a type of bar chart that shows comparisons between categories of data and breaks it down to compare of a whole.
4. Scatter Chart
With the help of Chart Buidler, you can eaisly create your attractive scatter chart in a few clicks. Scatter chart is a type of chart which displays values for typically two variables for a set of data using Cartesian coordinates.
5. Area Chart
Create your colorful area chart with Chart Builder. An area chart is typically a line chart, the area between axis and line are commonly emphasized with colors.
6. Donut Chart
Creating a Donut chart is no more complicated. Chart Builder helps you to create an interactive Donut chart using a drag-and-drop user interface. Donut chart is a variation on a Pie chart. It has a round hole in the center which can be used to display additional information.
7. Bubble Chart
Creating a Bubble chart was not that easy before. Chart builder makes it simple to create a Bubble chart without any technical assistance. A bubble chart is a variation of a scatter chart in which the data points are replaced with bubbles, and the dimension of the data is represented in the size of the bubbles.
8. Gauge Chart
Are you looking for a Gauge chart or speedometer for your dashboard? Create a stunning Gauge chart with the powerful Chart Builder in minutes. Gauge chart is a type of chart which uses a needle to show data as a reading on a dial.
9. Heatmap Chart
A Heatmap chart is a visualization of the data matrix where values are represented as colors. Chart Builder helps you to create complex and colorful Heatmap chart with a web-based, drag-and-drop utility in minutes.
10. Choropleth map
Are you tried to create a complex Choropleth map? Don't worry, Chart Builes helps you to create Choropleth map in a few clicks with no programming skills required. A Choropleth map displays a divided map in which geographical areas are shaded or colored in relation to a data variable.
11. Sunburst Chart
Creating a Sunburst chart in Chart Builder is a matter of just a few clicks. A Sunburst chart displays hierarchical data through a series of circles, which are carved for each node. Sunburst chart with multiple levels of categories shows how the outer circles the child relate to the inner circles the parent.
Chart Builder is responsive
Chart Builder uses HTML5 and Bootstrap CSS framework. Hence, it is fully capable to respond to the environment based on media's screen size, platform, and orientation.
The Charts generated by this tool are fully responsive and fit to any device you use. You can access your charts from anywhere, any time, on any standard browsers using any device such as PC, tablet or mobile phone.
Build your own colorful Dynamic Chart in minutes
Chart Builder comprises with D3.js JavaScript, SVG, and CSS technique to turn the static graph into an attractive dynamic chart which gives your users the full capabilities of modern browsers by combining powerful visualization components and detailed data on clicks and hover.
Conclusion
The Chart Builder is a powerful utility for retrieving and displaying data in a graphical layout, which doesn’t require any programming skill or IT assistance to generate beautiful, response and dynamic chart in minutes. This chart builder project offers a free and paid plan for Chart Builder. You can also find the FREE Chart Builder version. The source code and entire project are also available on GitHub under this licens for Open Source Community.
Not only this, but the Chart Builder is also available On-line for FREE. The Free Charts online version gives you the freedom to access your charts from anywhere. The Online Chart Builder generates universal HTML code to enable you to insert dynamics charts to your website.
If you want to take a look at our complete Chart Builder documentation and video tours of the latest version along with a live tour of user interface and step by step instructions for performing key features.
