Database Visualization Tool: Transform Your Data into Dynamic Dashboards
Database visualization made easy with our free open-source tool. Create interactive charts and dynamic dashboards using drag-and-drop features, compatible with MySQL, MS SQL, Oracle, and more. Ideal for visualizing real-time data without coding, this tool helps businesses and developers unlock data insights and improve decision-making through D3.js-based visualizations.
In today’s data-driven world, visualizing vast amounts of information is crucial for making informed decisions. The ability to understand patterns, trends, and anomalies quickly empowers organizations to take timely actions. But with so much data at hand, how can you efficiently visualize and interpret it? Here’s where a Database Visualization Tool comes in handy.
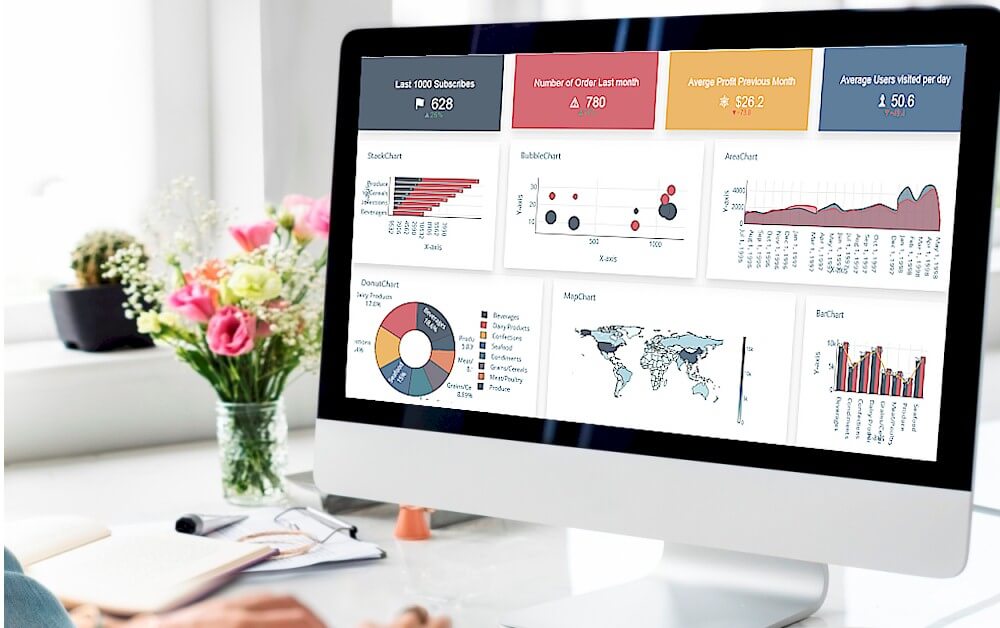
What is the Database Visualization Tool?
Our Database Visualization Tool is an open-source, HTML5-based solution designed to make visualizing complex data as simple as possible. Built on top of Apache, PHP, MySQL, and powered by a free charting engine, this tool offers a flexible, customizable environment with drag-and-drop functionality for ease of use. Whether you're connecting data from a MySQL database or integrating with MS SQL, Oracle, or PostgreSQL, this tool makes it easy to create charts and dashboards—no programming required!
Why You Need Database Visualization
Working with data in its raw form can be overwhelming. If you've ever tried to analyze data using spreadsheets or databases, you know how time-consuming and complex it can be to find useful insights. Data visualization transforms raw data into a visual format, making it more accessible and easier to comprehend.
Supported Chart Types
The Database Visualization Tool offers a range of chart types, including but not limited to:
- Line Charts
- Scatter Charts
- Bar Charts
- Pie Charts
- Heatmaps
- Sankey Diagrams
- Choropleth Maps
These charts are D3.js-based and dynamically reflect your data. They can either be static or updated in real-time, pulling data directly from databases such as MySQL, MS SQL, or PostgreSQL, among others.
Why Choose Our Tool?
The key differentiator of this tool is its open-source foundation, ensuring flexibility and scalability for users who want to tailor it to their needs. Some major highlights include:
- Drag-and-Drop Interface: Create dashboards and charts with no coding skills required.
- Database Integration: Connects seamlessly with MySQL, MS SQL, Oracle, SQLite, Sybase, and Cubrid databases.
- Variety of Formats: Import data from Excel and CSV files
- PHP-based Flexibility: Integrates easily with any PHP application and runs on Apache servers.
- Real-Time Data: Whether you're working with static or live data, the tool handles both with ease.
Key Benefits of Effective Data Visualization
Data visualization provides numerous advantages:
- Insightful Trends: Quickly identify trends, outliers, and data relationships that are difficult to see in raw formats.
- Simplified Data Presentation: Visual representations make complex datasets understandable for any audience, whether they are data experts or non-technical stakeholders.
- Enhanced Decision-Making: With easily interpretable visuals, organizations can make faster, more informed decisions based on real-time or historical data.
- Data Cleaning and Preparation: Visualization helps detect missing values, errors, or outliers in your data before conducting deeper analyses.
Getting Started with Database Visualization: Create Your First Dashboard
In today’s data-driven world, effective visualization is key to making sense of complex data sets. In this blog, we will walk you through the process of creating a simple dashboard using a free, open-source drag-and-drop data visualization tool. You’ll learn how to connect to a database, set up charts, and generate PHP source code for your web application.
Requirements
Before diving into the installation and setup process, ensure you meet the following requirements:
- Platforms: The data visualization tool can be installed on Windows, Linux, Mac, Ubuntu, or any platform that supports Apache.
- Software Requirements:
- PHP Version 7.2 or later
- Apache 2 or later
- Windows 7 or later / Linux 3 or later
- Firefox 52, Chrome 57, or Internet Explorer 8
Installation Steps
- Download the Tool: Get the free version of the Dashboard Builder from Dashboard Builder.
- Set Up: Place the downloaded files in a directory on your web server. For example:
- Unzip the Files: Extract the dashboard zip file into the root folder of
dashboardbuilder.
…/www/yoursite/dashboardbuilder-v72-FREE/
Database Visualization Examples
Before connecting your database, ensure your web server (e.g., Apache, Nginx) is configured to access the dashboard folder. Set the read and write permissions for the dashboard directories and subdirectories:
chmod -R 777 dashboardbuilder-v57-FREE
Use your browser’s inspector/console to check for any errors and ensure all files are loading correctly.
STEP-1: Connect with your Database
- Access the Web Folder: Open your web browser and navigate to:
- Select Database: Click the database icon. On the next screen, go to the Data Sources tab, select SQLite from the drop-down menu, and enter the database name as:
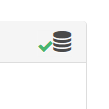
- Follow the on-screen instructions to save the changes. A green tick mark will appear next to the database icon, indicating a successful connection.
http://localhost/dashboardbuilder
This will bring up the data visualization welcome screen, which features a minimalist design with a fully responsive HTML5 interface built with PHP, HTML, JavaScript, and CSS.
../data/Northwind.db
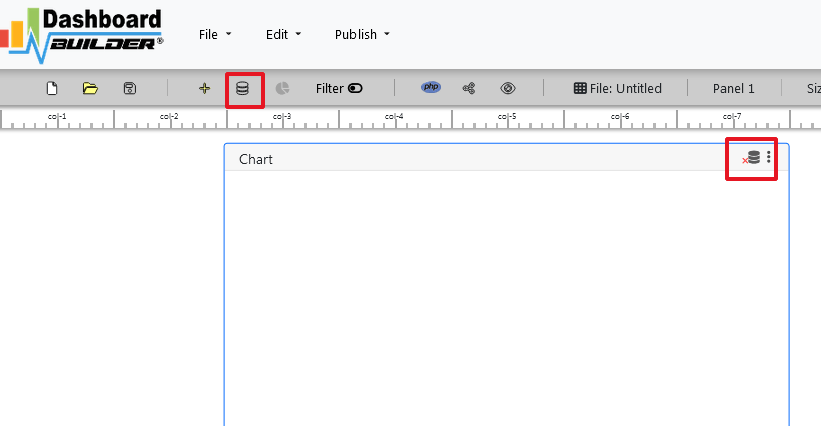
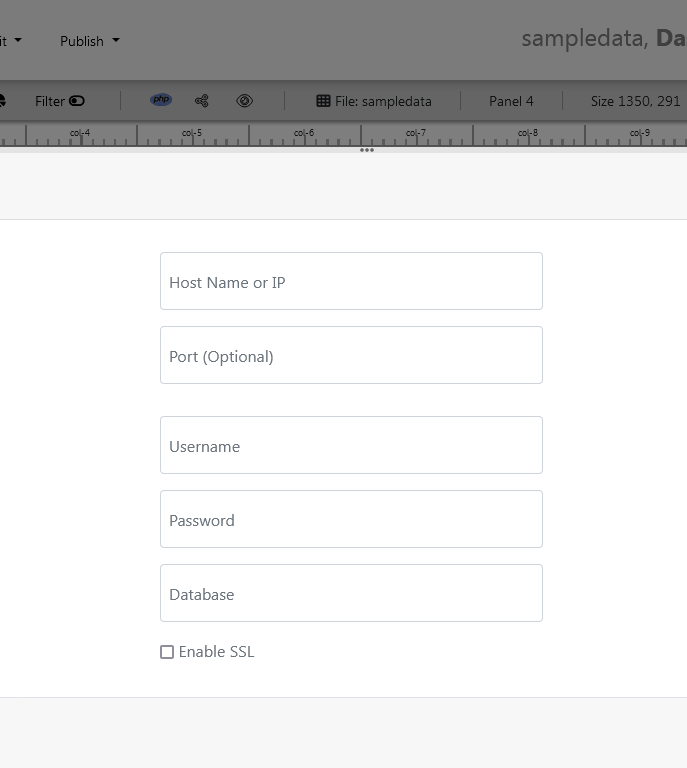
STEP-2: Configure Chart Settings
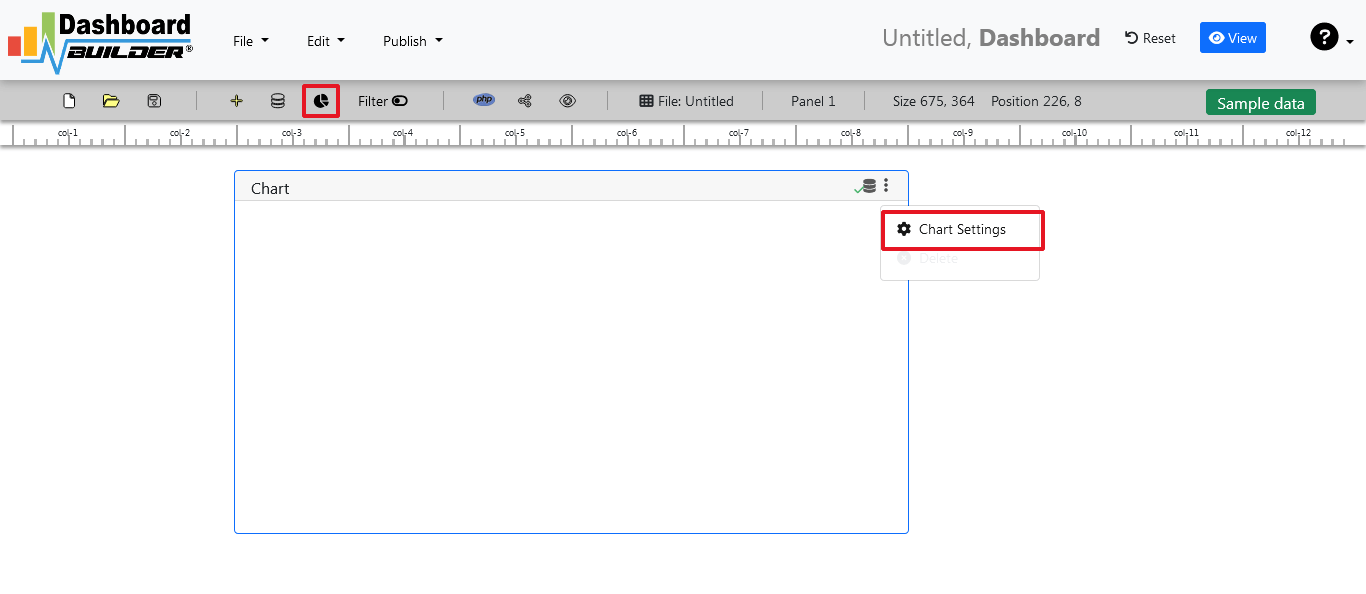
- Retrieve Data: Click on the gear icon to access chart preferences.
- You’ll see a list of tables from the connected database.li>

STEP-3: Input SQL Statements
- Create Your SQL Query: We will create a PHP application for sales management. Enter the following SQL statement in the provided text box:
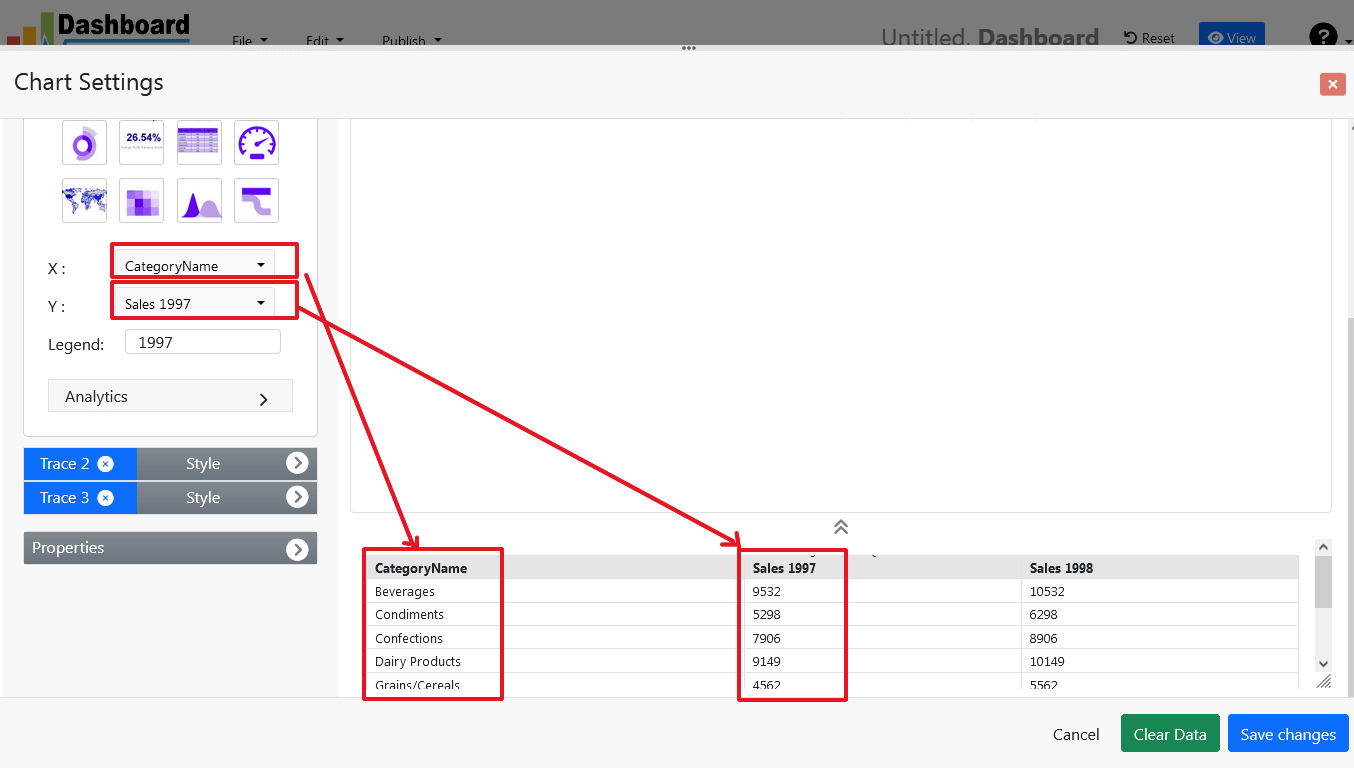
- Execute the Query: Click the Run Query button. The results will be displayed, allowing you to assign the x-axis and y-axis data by selecting from the drop-down lists.
- The query result will be displayed. Now we must assign data from the x-axis to the x-axis column and data from the y-axis to the y-axis column. Choose your x-axis data from the X drop down list, and your y-axis data from the Y drop down list.
- Click Save Changes
SELECT strftime('%Y-%m',o.shippeddate) as xaxis, sum(d.quantity) as yaxis from `order details` d, orders o
where o.orderid = d.orderid group by strftime('%Y-%m',o.orderdate) limit 50
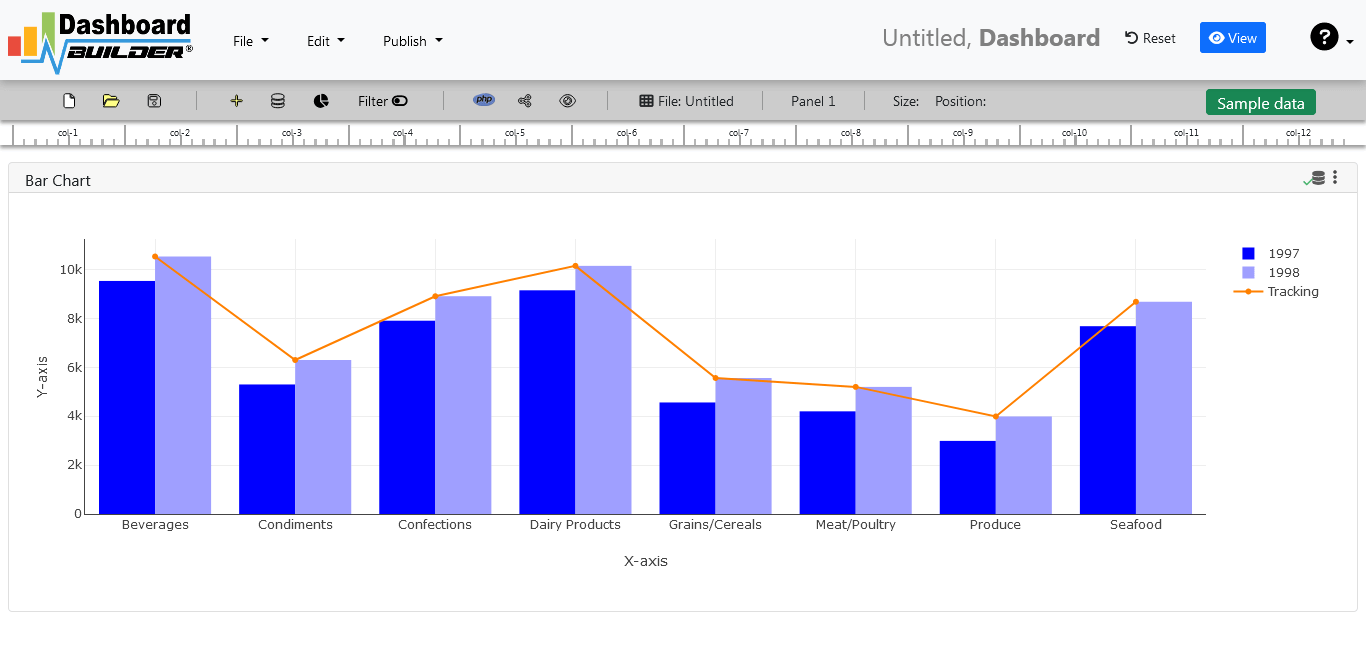
Charts will be appeared on the screen as shown below.
STEP-4: Adjust the Position of the Chart
- You can resize and reposition the Chart Panel by dragging its corners, making it fully responsive according to the Bootstrap framework.
STEP-5: Generate PHP Code
- Finalize Your Dashboard: Once your dashboard is ready, click the Generate PHP button. The PHP source code for the chart will be automatically generated.
- Copy the Code: You can now copy and paste this PHP script into your application or website.

The PHP dashboard source code for the chart will be generated automatically; you can copy and paste this dashboard PHP script into your PHP application.
Database visualization tool source code
Following is an auto-generated PHP source code of Database visualization tool. This source code can be used with any PHP application, website, or any other PHP based framework.
/**
 * DashboardBuilder
 *
 * @author Diginix Technologies www.diginixtech.com
 * Support  - http://www.dashboardbuilder.net
 * @copyright (C) 2018 Dashboardbuilder.net
 * @version 2.1.5
 * @license: license.txt
 */

include("inc/dashboard_dist.php");  // copy this file to inc folder


// for chart #1
$data = new dashboardbuilder();
$data->type =  "line";

$data->source =  "Database";
$data->rdbms =  "sqlite";
$data->servername =  "";
$data->username =  "";
$data->password =  "";
$data->dbname =  "data\Northwind.db";
$data->xaxisSQL[0]=  "SELECT strftime(^%Y-%m^,o.shippeddate) as xaxis, sum(d.quantity) as yaxis from `order details` d, orders o  where o.orderid = d.orderid group by strftime(^%Y-%m^,o.orderdate) limit 50";
$data->xaxisCol[0]=  "xaxis";
$data->yaxisSQL[0]=  "SELECT strftime(^%Y-%m^,o.shippeddate) as xaxis, sum(d.quantity) as yaxis from `order details` d, orders o  where o.orderid = d.orderid group by strftime(^%Y-%m^,o.orderdate) limit 50";
$data->yaxisCol[0]=  "yaxis";
$data->name = "linechart";
$data->title = "Line Chart";
$data->orientation = "";
$data->xaxistitle = "x-axis title";
$data->yaxistitle = "y-axis title";
$data->showgrid = "";
$data->showline = "";
$data->height = "167";
$data->width = "";
$data->col = "0";
$result[0] = $data->result();

?>

<!DOCTYPE html>
<html>
<head>
	<script src="assets/js/dashboard.min.js"></script> <!-- copy this file to assets/js folder -->
	<link rel="stylesheet" href="//maxcdn.bootstrapcdn.com/bootstrap/3.2.0/css/bootstrap.min.css"> <!-- Bootstrap CSS file, change the path accordingly -->

<style>
@media screen and (min-width: 960px) {
.id0 {position:absolute;margin-top:67px;}

}
.panel-heading {line-height:0.7em;}
#kpi {font-size:34px; font-weight:bold;text-align:center;}
#kpi_legand {font-size:11px; color:#999;text-align:center;}
</style>


</head>
<body>

<div class="container-fluid main-container">
<div class="col-md-12 col-lg-12 col-xs-12">
<div class="row">
<div class="col-md-4 col-lg-4 col-md-offset-4 col-lg-offset-4 col-xs-12 id0">
<div class="panel panel-default">
<div class="panel-heading">Line Chart</div>
    <div class="card-body">
        <?php echo $result[0];?>
    </div>
</div>
</div>
</div>
</div>
</div>
</body>
Conclusion
Data visualization is essential for organizations that want to leverage their data for actionable insights. This free and open-source Database Visualization Tool is designed to simplify the process for everyone, whether you’re a developer or a non-technical user. With drag-and-drop ease, real-time capabilities, and support for multiple database types, this tool can transform how you view and interpret data.