Dashboard examples overview
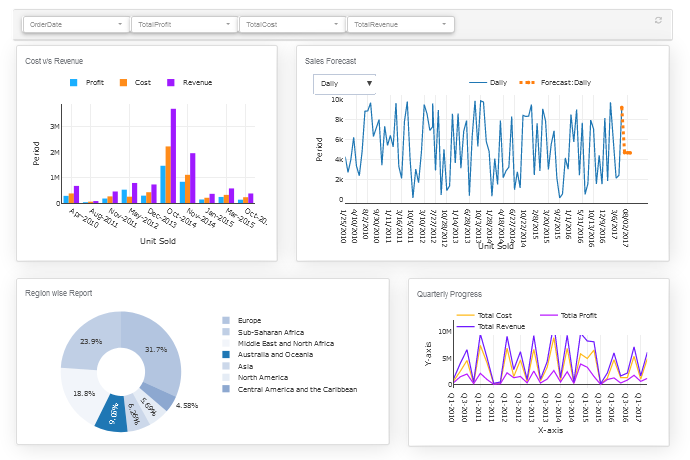
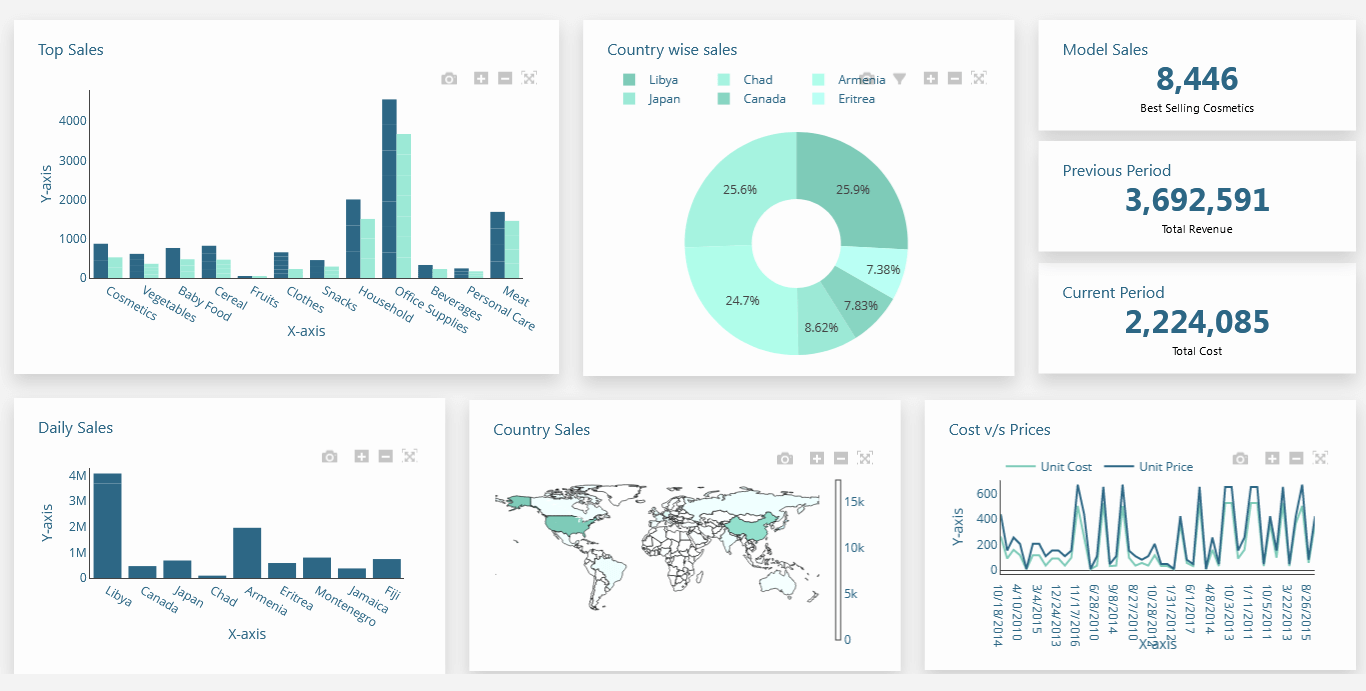
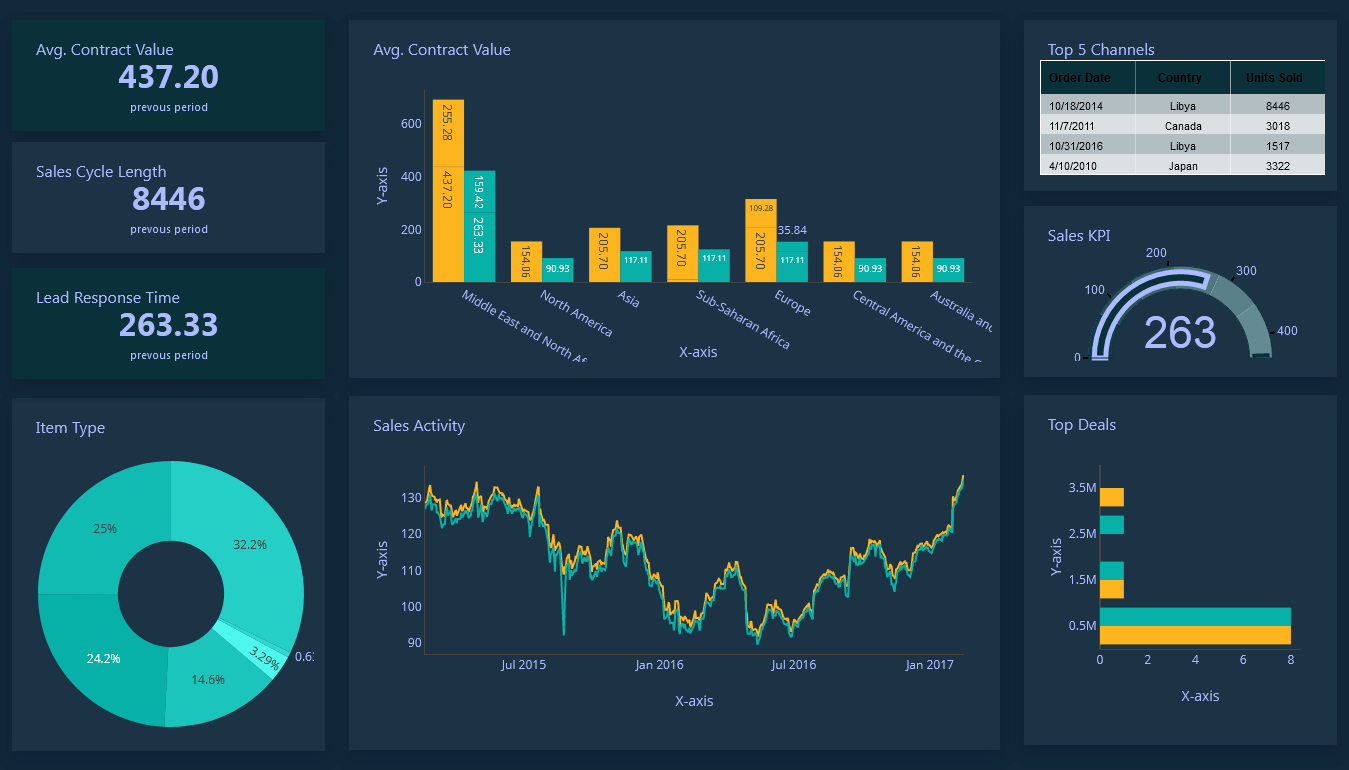
These great tips and expert techniques given in the examples can be used to create your dashboard in a remarkably and simple way to facilitate you with a great rich filter control to track and monitor your key performance indicators and improve the visualization of your business metrics in a simple way.
Drill Through Dashboard
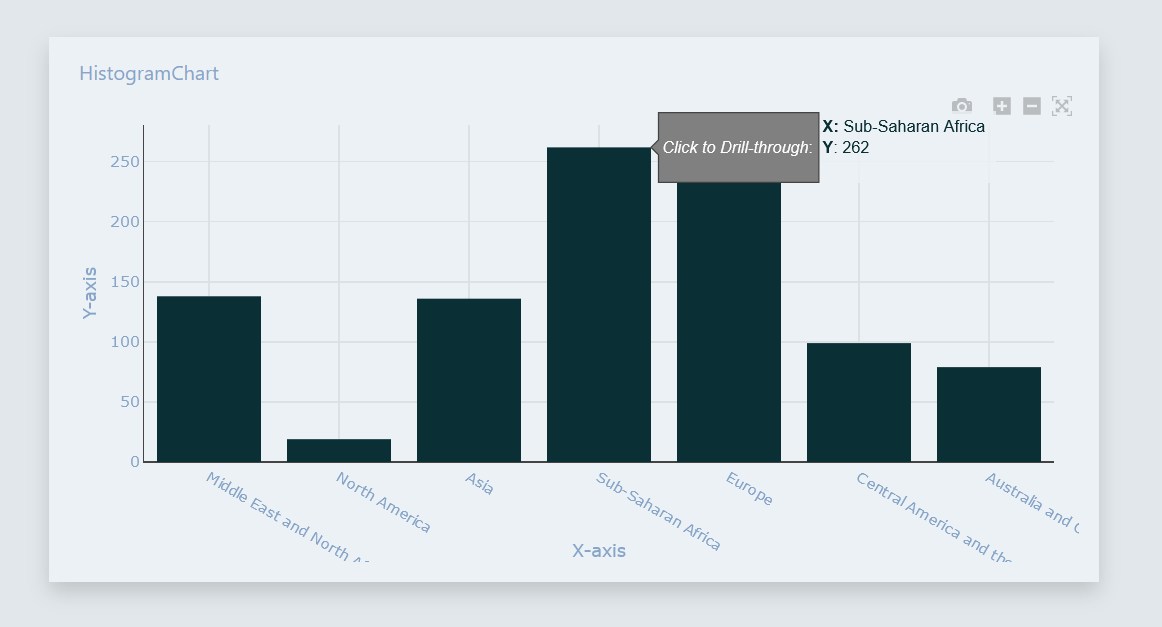
A Drill through dashboard is designed to provide deeper insights for users who need to explore data at a granular level. This dynamic tool allows users to start with a high-level summary and seamlessly navigate into more detailed reports, uncovering specific trends and patterns. With its interactive features, it empowers decision-makers to investigate underlying data points, ensuring thorough analysis and informed decision-making


