KPI Dashboards: The Key to Effective Business Performance Tracking
KPI Dashboard is an essential tool for businesses looking to track and analyze their most important performance metrics in real time. By consolidating data from various sources, a well-designed KPI Dashboard provides a comprehensive view of key performance indicators (KPIs) across departments such as sales, marketing, finance, and operations. This powerful tool enables teams to monitor progress, identify trends, and make informed decisions that align with strategic objectives. Discover how KPI Dashboards simplify business performance tracking. Build interactive, customizable dashboards to monitor KPIs in real-time with Dashboard Builder.
What are KPI Dashboards?
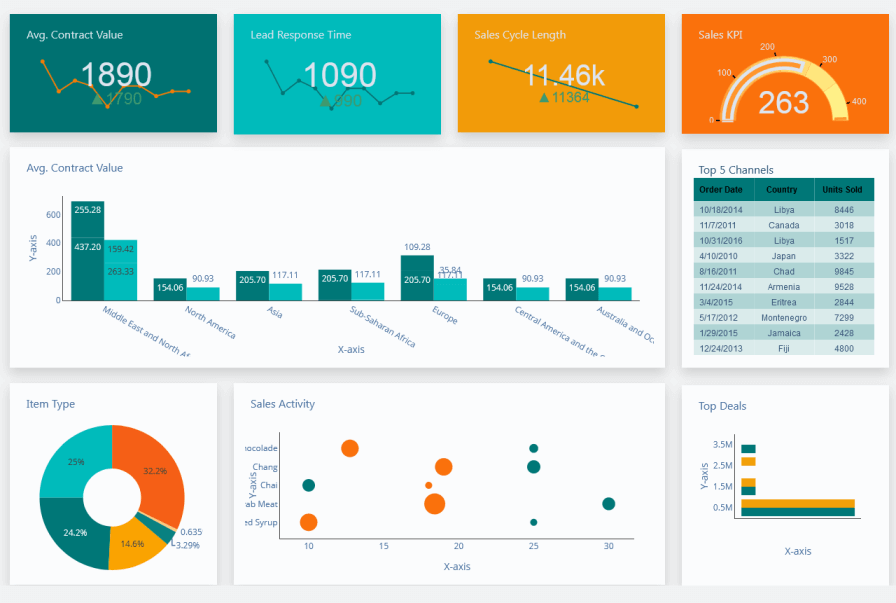
A KPI dashboard is a tool that designed to help businesses in tracking, measuring, and easily comprehending key performance indicators (KPIs). KPIs are metrics that help organizations measure progress towards their strategic goals and objectives. A KPI dashboard typically gathers data from various sources and presents it in an organized and visually appealing format, allowing users to quickly and easily identify trends, patterns, and areas for improvement.
The main objective of a KPI dashboard is to provide a quick and a comprehensive view of an organization's performance at a glance. It allows users to monitor the progress of their KPIs in real-time, compare performance over time, and analyze data to identify insights and opportunities. This can be especially useful for businesses that operate in fast-paced environments, where quick decision-making is critical.
Why Your Business Needs a KPI Dashboard
A KPI dashboard brings all your KPIs together in one place. You can see how you’re performing on each different measurement, side by side by using a drag and drop features.
For example, let’s say you want to increase your yearly profits by 10%. Meanwhile, you’ve told your sales team that they’re expected to hit, say, 30 sales of a new product per month. Most of your team is hitting their targets, but profits are stagnating.
In such case you will need to find a KPI software to more emphasis on securing renewals than bringing in new customers and helps you out to find that how your renewal rates are affected into your profits.
Why KPI dashboard is important?
Fortunately, there is one of the best KPI dashboard software available that makes your job much easier. KPI open-source software not only saves your time but also lets you cut out your developer team and take control of your data. In earlier , KPI dashboard open source, companies needed IT developer to analyze the data. The possibility to become more independent and not rely all the time on IT developers is an attractive feature that the KPI dashboard tool holds both for IT and Business Inelegance teams.
Our KPI software supports a drag and drops web interface, which requires no installation at all. It helps you to create KPI dashboard for your business needs and help you to generate PHP source code for your web application, download your KPI dashboard in PNG as image and send reports to your colleagues.
KPI dashboard with Excel and other data source
Our KPI dashboard allows user who even doesn’t have computer skills to connect the huge number of the database using PDO such MySQL, MS SQL, SQLite, PostgreSQL, Sybase, and Cubrid. Not only this, but KPI dashboard excel also helps you to connect upload your CSV and MS EXCEL files to fetch data in just a few clicks and create interactive and dynamic Excel KPI dashboards in a minute. The KPI dashboard excel free download and paid plans details are available here
What is the difference between a dashboard and a KPI?
A dashboard and Key Performance Indicators (KPIs) are both tools used in business management to monitor and analyze performance, but they serve different purposes:
| Dashboard: | Key Performance Indicators (KPIs): |
|---|---|
| A dashboard is a visual representation of various data points, metrics, and key performance indicators consolidated into a single interface. | KPIs are specific metrics used to evaluate the success of an organization, department, or individual in achieving its objectives and goals. |
| It provides an overview of the organization's performance across multiple areas, such as sales, marketing, finance, and operations. | KPIs are quantifiable and measurable, providing insight into performance against predefined targets or benchmarks |
| Dashboards often include charts, graphs, tables, and other visualizations to make complex data more understandable at a glance. | Unlike dashboards, which present a broad overview of various metrics, KPIs are focused on highlighting the most critical aspects of performance |
| Dashboards are customizable and can be tailored to meet the specific needs of different stakeholders within the organization. | KPIs are typically selected based on their relevance to organizational objectives, and they serve as a means of assessing progress and driving improvement initiatives. |
| They enable users to track trends, identify patterns, and make data-driven decisions in real-time. | While dashboards may display multiple KPIs, each KPI represents a single performance metric that is crucial for monitoring and managing the organization's success. |
In summary, a dashboard is a comprehensive visual display of various metrics and data points, while KPIs are specific performance indicators used to measure progress towards organizational goals. Dashboards often incorporate KPIs among other metrics to provide a holistic view of performance across different areas of the business.
The most popular charts type to create a catchy KPI dashbaord
KPI dashboard supports all famous and most widely used chart type which including the following
- 3D-Line
- Area
- Bar
- Bubble
- Choropleth map
- Donuts
- Gauge
- Heatmap
- Line
- Pie
- Sankey diagrams
- Scatter
- Stack
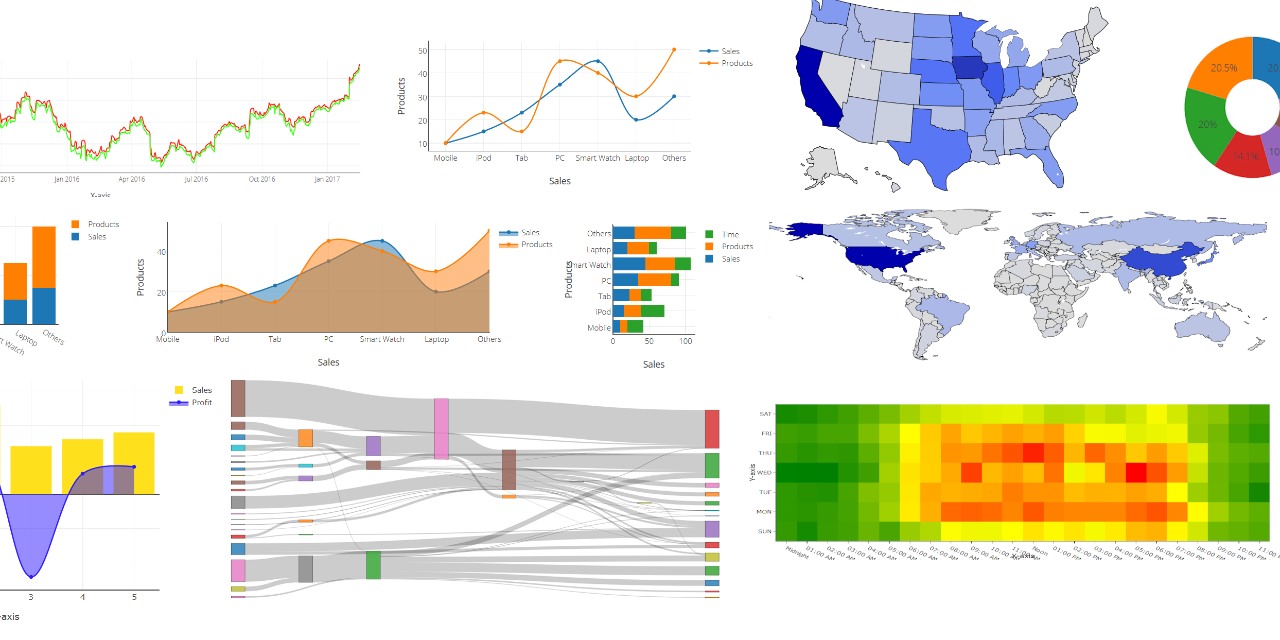
All of these charts are responsive which means the KPI dashboard responds to the media's screen size, platform, and orientation to render the KPI dashboard to fit on a variety of devices such as MS Window, mobile phones, tablets, and PC’s screen sizes.
All the charts of dashboard KPI are dynamically built-in using D3.js framework. This means it handles on mouse click and hovers on the charts to display more detailed information related to the KPI. The user can also download these dynamic charts in PNG image format.
KPI dashboard allows you to customize the layout of your dashboard with a powerful drag-and-drop tool for optimal representation with a fully responsive and compatible all type of devices such as PC, mobile phone and tablets.
KPI dashboards produced by the KPI open source software are full dynamic which is based on D3.js framework one of the most widely used JavaScript library for producing dynamic data in a browser. KPI dashboard uses the widely implemented SVG, HTML5, and CSS standards which can be created either static or real-time data coming from a variety data sources including Excel.
KPI Dashboards vs. Regular Dashboards
A KPI dashboard is a specialized type of dashboard that focuses on tracking and visualizing key performance indicators (KPIs). While a regular dashboard provides a broader overview of various metrics, a KPI dashboard specifically highlights the most critical aspects of performance. KPIs are quantifiable and measurable metrics that provide insight into performance against predefined targets or benchmarks. A KPI dashboard often includes charts, graphs, and tables to make complex data more understandable at a glance.
| Feature | KPI Dashboard | Regular Dashboard |
|---|---|---|
| Focus | Key Performance Indicators (KPIs) | Broader range of metrics |
| Purpose | Track progress towards specific goals | Provide a general overview of performance |
| Data | Quantifiable and measurable metrics | Can include both quantitative and qualitative data |
| Visualization | Often includes charts, graphs, and tables | Can include various visualizations, including charts, graphs, tables, and maps |
| Use Cases | Performance management, strategic planning, decision-making | Monitoring operations, reporting, and analysis |
The Ultimate Guide to KPI Dashboards: Tailored Solutions for Every Need
Key Performance Indicator (KPI) dashboards have become indispensable tools for businesses striving to streamline operations, analyze performance, and make informed decisions. Let’s explore tailored KPI dashboards designed for various business functions:
KPI Dashboard for Sale
A KPI dashboard for sales is essential to monitor sales pipelines, conversion rates, and revenue growth. It provides real-time insights into sales targets, top-performing products, and team performance. By visualizing trends, businesses can fine-tune their strategies to maximize revenue.
KPI Dashboard for Marketing
Marketing professionals rely on KPI dashboards to track campaign performance, customer engagement, and return on investment (ROI). Metrics like website traffic, lead generation, and conversion rates are displayed in an intuitive format, enabling teams to adjust campaigns and improve results.
KPI Dashboard for Financial Management
Financial management dashboards provide a comprehensive overview of an organization’s financial health. Key metrics such as revenue, expenses, profit margins, and cash flow are tracked to help businesses maintain profitability and ensure compliance with financial regulations.
KPI Dashboard for Startups
Startups thrive on agility and data-driven decisions. A KPI dashboard for startups focuses on customer acquisition cost (CAC), monthly recurring revenue (MRR), and runway tracking. These metrics ensure startups remain financially healthy while scaling their operations.
KPI Dashboard for Supply Chain
Supply chain KPI dashboards streamline the management of procurement, production, and logistics. Key indicators like inventory levels, on-time delivery rates, and supplier performance help businesses optimize operations and reduce costs.
KPI Dashboard for Warehouse
Warehouse dashboards are designed to track inventory accuracy, order fulfillment rates, and space utilization. By ensuring efficient operations, they help reduce waste and improve overall productivity within the warehouse.
KPI Dashboard for Accounts Receivables
Managing cash flow is critical, and accounts receivables dashboards focus on metrics like days sales outstanding (DSO), overdue invoices, and collection efficiency. These dashboards empower businesses to optimize payment cycles and maintain financial stability.
KPI Dashboard for HR
HR dashboards provide insights into employee performance, retention rates, and recruitment effectiveness. Metrics like employee satisfaction and training progress help HR teams make data-driven decisions to enhance workplace productivity and culture.
KPI Dashboard for Performance Analysis
Performance analysis dashboards are critical for evaluating business objectives. They highlight key metrics such as productivity, efficiency, and goal completion rates, allowing managers to identify strengths and areas for improvement.
KPI Dashboard for Operations
Operational efficiency is at the heart of every business. Operations dashboards focus on process optimization by tracking metrics like production output, downtime, and operational costs, enabling organizations to stay competitive.
No matter your industry or department, a well-designed KPI dashboard is the cornerstone of success. By leveraging these tailored solutions, businesses can transform data into actionable insights, drive performance, and achieve strategic goals.
KPI metrics dashboard examples
Below are metrics dashboard examples using Dashboard Builder application. These metrics dashboards focus on key metrics of for example NGO KPI, Human Resources KPI, Accounts receivables KPI, Sales and Marketing KPI, Financial Management KPI, Performance Analysis KPI and many more.
How to Create a KPI Dashboard with Dashboard Builder
In this section, we will be creating a KPI dashboard using our drag and drop tool and generate PHP code for our KPI matrics without any assistance of IT.
Requirements:
- PHP Version 7.2 or later
- Apache or Nginx
- Windows, Linux or Ubuntu
- Firefox 52, Chrome 57, IE 8
- KPI Dashboard. Available for downloading
Note: The project also offers free and paid plans. Click here for more details
Installation
- You can download KPI Dashboard software tool fromKPI Dashboard software tool
- Place the files in a directory on the web server. e.g.
…/www/yoursite/dashbboardbuilder-v33-FREE/ - Unzip
 the file dashboard using Extract Here option to the root folder of "dashboardbuilder"
How do I create a KPI dashboard?
Making a dashboard KPI is not a challenging anymore. Any one who even doesn't have computer literacy can make dashboard KPI by following the below three effortless steps
3 simple and effortless way to generate amazing KPI dashbaords
STEP-1: Retrieve your data from your data source
The KPI dashboard software tool which we are using to create KPI metrics supports a great number of data sources and all major databases such as MySQL, MS SQL, SQLite, PostgreSQL, Sybase, and Cuboid to retrieve the data and create dynamic sunburst chart. But this is not the limit, if you have data in Excel or in a CSV file, this great KPI dashboard software tool is also able to fetch data from these sources using the upload sub-tab as shown in the picture below.
Tip: To retrive data from database, PDO drivers such as mysql, sqlite must be installed. For more details please have a look at our Documentation
- Run the web folder in your browser. e.g. http://localhost/dashboardbuilder following welcome screen will appear.
- Now Click the Database icon
- Following screen will appear. In our KPI dashbaord example, we will use a sample MS Excel file called sales-2019.xls to retreive the data. Now, Select MS Excel file from your computer and Save changes as mentioned in the screen.
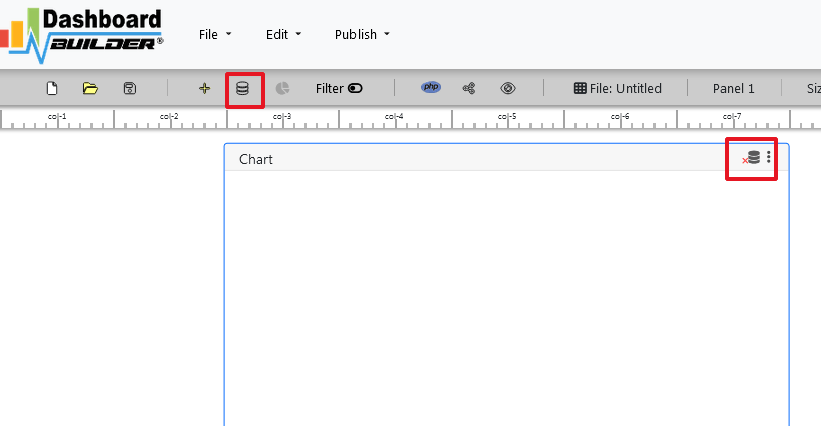
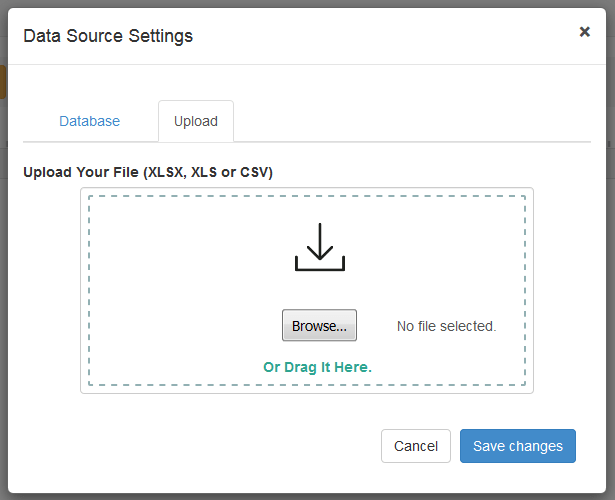
- When you click the Save changes , a green tick mark with Excel icon will appear that shows that your Excel file is successfully uploaded and connected.
Step-2 Setting your chart preference
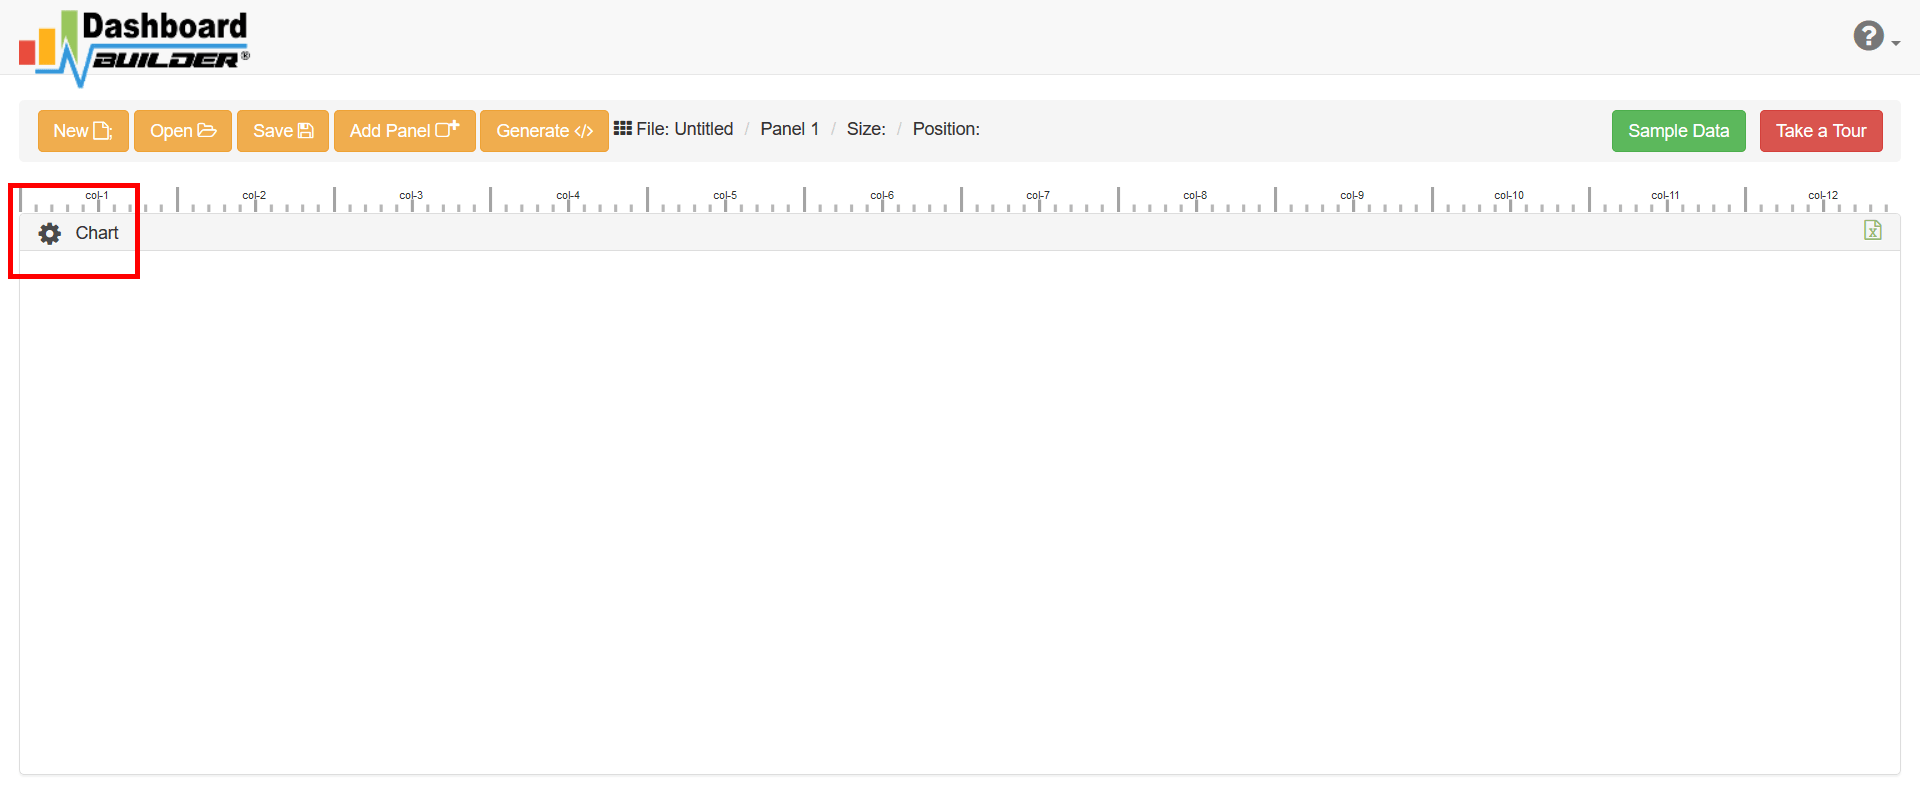
With this great dashboardbuilder tool you have the freedom to select your data for ids, parents and label nodes in a single click.
- To do so, select the gear icon for your Dashboard preference.
Step-3 Setting your KPI dashboard
- The following screen will appear showing the data fetched from the Excel file.
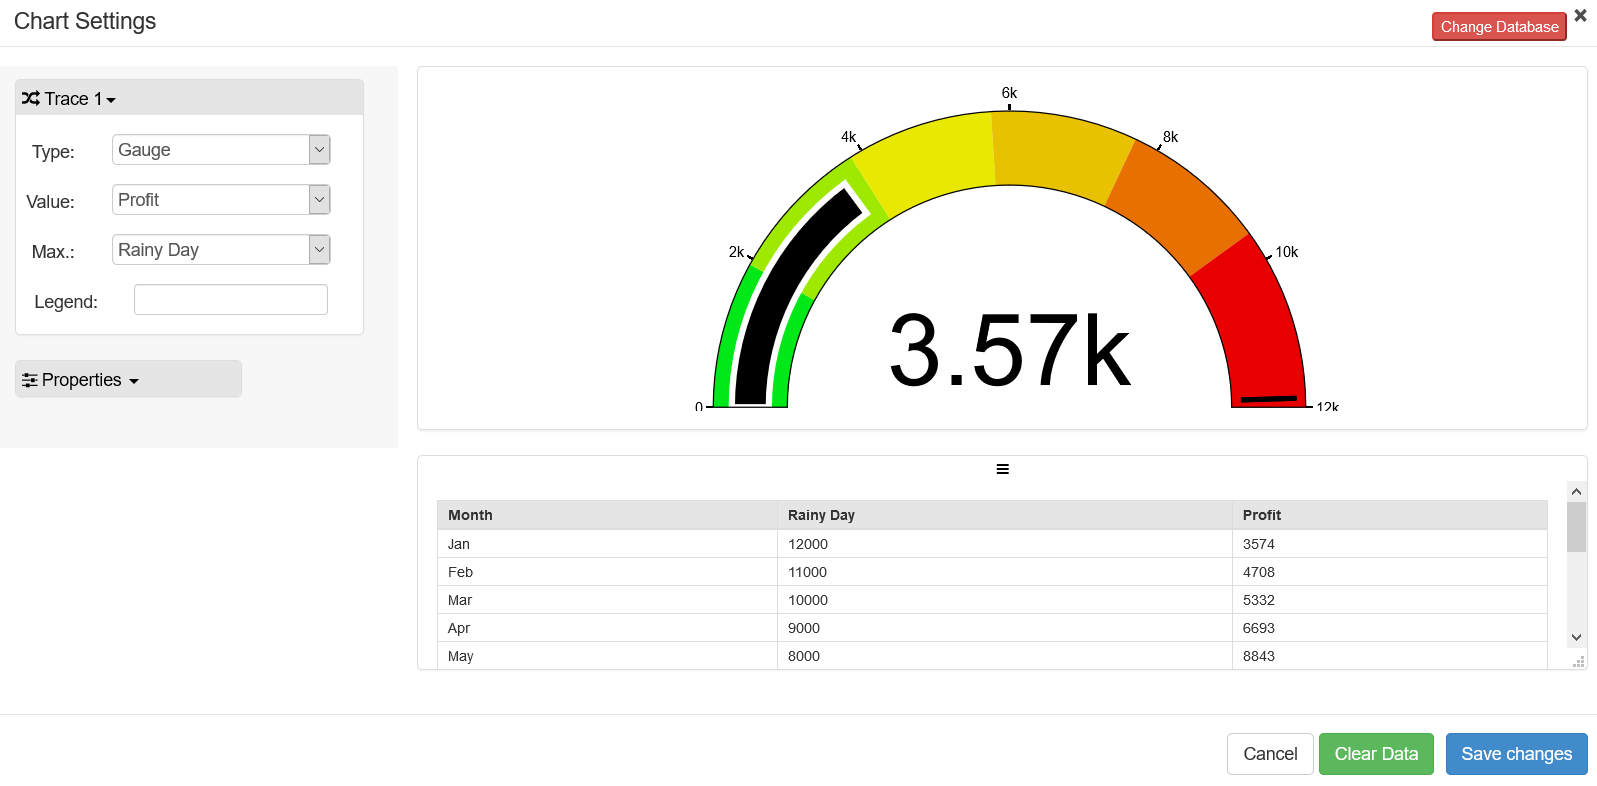
- Now, select "Sunbursr" chart from the drop down list of type
- Select "ids" from the drop down list of Ids
- Select "parent" from the drop down list of Parent
- And select "label" from the drop down list of Label
- Click Save Changes
- You may adjust the size and the position of the Chart Panel by draging it's corncer.
- Now Click the Generate button

- PHP code for your KPI dashboard will automatically generate, which can be copy past to your PHP application.
Note: The auto-generated source code for KPI dashboard is released under MIT license, which allows you to customize as per your desire and can be used anywhere you want.
FAQs About KPI Dashboards
Affordable KPI Dashboard Solutions
Looking for an affordable solution to track and manage your business KPIs effectively? Our KPI Dashboard offers a range of features tailored to meet your needs, whether you're a small business or a large enterprise. Explore our flexible pricing options and choose the plan that suits you best.
View Pricing DetailsGet your KPI dashboard software free
In this KPI dashboard example, we have gone through with various features supported by KPI dashboard and how to create a dynamic dashboard using the KPI dashboard with a drag and drop tool which is based on Bootstrap framework and gives you the freedom of using KPI dashboard template without any restriction. KPI dashboard freeware offers both KPI dashboard free and paid plans. This KPI dashboard software free version also be found on GitHub under this license for KPI dashboard Open Source Community.
Best of all, with our Standard and Enterprise licenses include 100% source code, for you to enhance the functionality or incorporate KPI Dashboard into your web application or any other software solutions/products, analytics/data science/data warehouse enterprise systems or Joomla, Wordpress or Drupal sites.
All editions of our KPI Dashboard app series are still fully functional, for sale and supported and provides increasing levels of support to address the queries of users and developers. KPI Dashboard can also be implemented using our online KPI library dashboard call the API, where you don’t have to worry about the installation, setup, configuration and other basic requirements of web server. The online API uses universal HTML code which can be used in any platform. The data will be added or retrieved from the database using the API. You may find more information about the Online KPI Dashboard.
You may want to take a look at our complete documentation and video tours of the latest version along with a live tour of user interface and step by step instructions for performing key features.KPI software free download and for using online KPI dashboard free are available at the following links
 the file dashboard using Extract Here option to the root folder of "dashboardbuilder"