What is Data Visualization? Exploring Definition, Examples, Procedure, Techniques, and Elements
Mastering Data Visualization: From Insights to Impactful Visuals
In today's data-driven world, the ability to interpret and communicate complex information effectively is paramount. This is where data visualization steps in as a powerful tool. Data visualization is the art and science of representing data through visual and graphical means to uncover insights, patterns, and trends that might be difficult to discern in raw data alone. By transforming data into visual representations, it becomes easier for both experts and non-experts to comprehend and make informed decisions based on the information presented.

Data Visualization Definition
Data visualization refers to the practice of representing complex sets of data and information through visual and graphical means, enabling individuals to grasp patterns, relationships, and insights that might be concealed within raw data. By using visual elements such as charts, graphs, maps, and diagrams, data visualization transforms intricate data points into accessible and understandable formats, facilitating effective communication, analysis, and decision-making.
Overview of Data Visualization
Data visualization is the art and science of translating intricate data sets into visual formats that transcend the limitations of traditional numerical presentations. By harnessing the potential of charts, graphs, maps, and other visual elements, data visualization encapsulates the power to unveil hidden trends, correlations, and insights that might otherwise remain obscured in spreadsheets and databases.
Importance of Data Visualization Tools
Data visualization tools hold immense importance in converting raw data into meaningful insights, rendering intricate information more comprehensible, and enabling actionable outcomes. They visually represent data, facilitating the identification of hidden patterns, trends, correlations, and anomalies that might remain obscured within raw data. In the contemporary era of data reliance, the significance of data visualization tools cannot be overstated, as they empower informed decision-making and effective communication of information.
Purpose and Benefits of Data Visualization Tools
Importance: Data visualization tools play a crucial role in transforming raw data into meaningful insights, making complex information more accessible, understandable, and actionable. They provide a visual representation of data, allowing individuals and organizations to identify patterns, trends, correlations, and outliers that might not be apparent in raw data alone. In today's data-driven world, the importance of data visualization tools cannot be overstated, as they facilitate informed decision-making and effective communication of information.
Purpose:
- Understanding Data: Data visualization tools help users comprehend data more effortlessly by transforming numbers and statistics into visual elements like graphs, charts, and maps. These visuals make it simpler to grasp the context and relationships within the data.
- Identifying Patterns and Trends: Visualizations empower users to identify patterns and trends in data, such as seasonal variations, growth trends, and cyclical patterns. This aids in making predictions, identifying opportunities, and mitigating risks.
- Exploring Relationships: Data visualization tools enable users to explore relationships between variables. Scatter plots, heat maps, and network diagrams help reveal connections, correlations, and dependencies among different data points.
- Detecting Anomalies: Visualization tools can highlight anomalies, outliers, and unexpected deviations in data, which might be indicative of errors or exceptional events. Detecting these anomalies is crucial for data quality control and decision-making.
- Comparing Data: Visualizations facilitate effortless comparison of different datasets or variables. Bar charts, pie charts, and histograms enable quick analysis of proportions, distributions, and variations between categories.
- Communicating Insights: Visual representations are often more compelling and memorable than raw data. Data visualization tools help in communicating insights and findings to a broader audience, including stakeholders, team members, and clients.
Benefits:
Data visualization tools offer a multitude of benefits, ranging from improved understanding and decision-making to effective communication and collaboration, ultimately leading to enhanced business outcomes and strategic insights.
- Clear Insights: Data visualization tools transform complex data into visual representations, making it easier to understand and interpret intricate patterns, trends, and relationships.
- Enhanced Decision-Making: Data visualizations enable quicker identification of trends, anomalies, and key insights, leading to informed and data-driven decision-making.
- Efficient Communication:Data visualizations simplify the communication of data-driven insights to both technical and non-technical audiences, facilitating a shared understanding of information.
- Pattern Recognition: Data visualization tools help users detect hidden patterns, correlations, and outliers that might not be apparent in tabular data, aiding in identifying opportunities and risks.
- Interactive Exploration: Many data visualization tools offer interactive features that allow users to explore data from different angles, facilitating deeper exploration and understanding.
- Data Storytelling: Data Visualizations facilitate the creation of compelling narratives around data, making it more engaging and memorable for conveying insights to stakeholders.
- Real-Time Monitoring: Real-time data visualizations provide immediate insights into ongoing processes, enabling timely responses and proactive interventions.
- Collaboration and Engagement: Data visualizations promote collaboration by enabling teams to work together on analyzing and interpreting data, fostering data-driven discussions.
- Quick Problem-Solving: Data visualizations help users identify bottlenecks, inefficiencies, and areas for improvement, enabling rapid problem-solving and optimization.
- Effective Planning: By visualizing historical data and trends, organizations can make accurate forecasts and strategic plans for future endeavors.
- Data Quality Assurance: Data visualization tools assist in identifying data errors, outliers, and inconsistencies, contributing to maintaining high data quality standards.
- Increased Engagement: Data visualizations captivate audiences and enhance engagement in presentations, reports, and dashboards, increasing the impact of communicated insights.
- Customization: Data visualization tools allow users to tailor visualizations to their specific needs, creating visuals that best represent the data's significance.
- Visual Exploration of Big Data: Data visualizations simplify the comprehension of large and complex datasets, aiding in identifying meaningful insights without getting lost in the data volume.
- Holistic View: Data visualizations provide a comprehensive view of data, enabling users to see the bigger picture and make strategic decisions based on a broad perspective.
- Track Progress: Data visualizations help track progress toward goals, KPIs, and targets over time, enabling organizations to adjust strategies as needed.
- Efficient Reporting: Data visualizations reduce the need for lengthy textual explanations, making reports more concise and reader-friendly while maintaining information depth.
- Predictive Analytics: Data visualizations combined with predictive models allow organizations to anticipate future trends and outcomes based on historical data.
- Increased ROI: Data visualization tools enable businesses to make better use of their data resources, leading to more efficient operations and higher returns on investments.
- Data Transparency: Data visualizations make data transparent and accessible to various stakeholders, fostering trust and accountability in decision-making processes.
Examples of Data Visualization

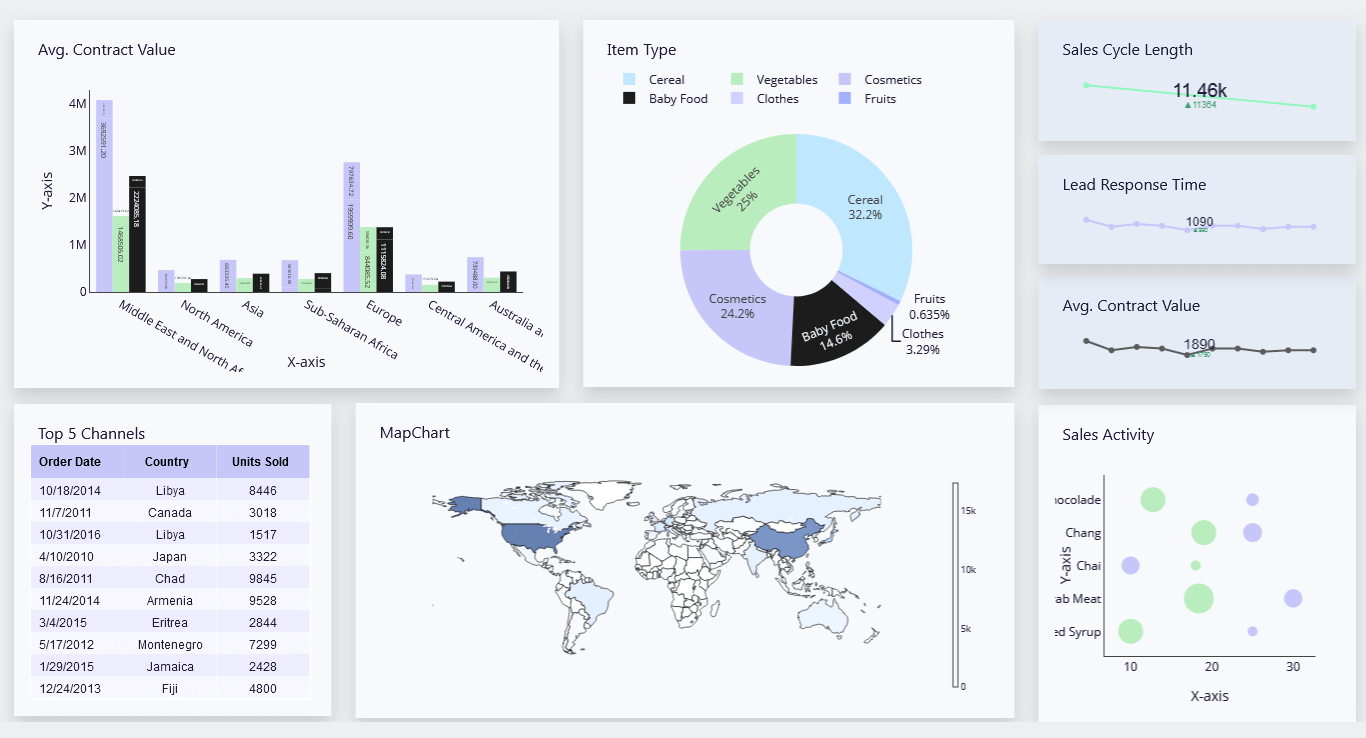
Data visualization takes many forms, from simple bar charts to intricate interactive dashboards. Some common examples include:
- Line Graphs: These show trends over time, making them useful for visualizing changes or patterns in data sequences.
- Bar Chart: A graphical depiction where data is represented by vertical or horizontal bars, indicating the value or frequency of different categories.
- Area Chart: A visual representation that portrays quantitative data as filled areas beneath a line, conveying the cumulative value of different categories over a continuous interval.
- Pie Chart: A visual representation that displays data as segments of a circular pie, showcasing the proportion of each category in relation to the whole.
- Scatter Plots: These display the relationship between two variables, helping to identify correlations and outliers.
- Histograms: These depict the distribution of numerical data, illustrating frequency within certain ranges.
- Heatmaps: These represent data values with colors on a grid, effectively showing the distribution and intensity of values.
- Maps and Geospatial Visualizations: These use geographical maps to display data related to specific locations, aiding in spatial analysis.
5 Important Steps for Effective Data Visualization
The process of effective data visualization involves a series of deliberate steps. These steps guide you from defining your goals to producing a polished data visualization that effectively communicates insights It commences with a clear understanding of the visualization's objective and the intended audience. Selecting the appropriate visualization format follows, ensuring that it resonates with the nature of the data and the insights sought. Data preparation and organization are paramount, as clean and accurate data is the bedrock of any successful visualization.
By adhering to the following 5 steps, you can create impactful data visualizations.
- Define the Objective and Audience: Clearly establish the purpose of your data visualization. Understand what insights you want to extract from the data and who your target audience is. Different audiences may require different levels of detail and complexity in the visualizations.
- Select the Right Visualization Type: Choose the most suitable visualization format based on the nature of your data and your objectives. Common types include bar charts, line graphs, scatter plots, pie charts, and maps. The chosen visualization should effectively communicate the relationships, patterns, and trends you aim to convey.
- Prepare and Organize the Data: Ensure your data is accurate, clean, and well-organized. This might involve data cleaning, transformation, and aggregation. Data quality significantly impacts the accuracy and credibility of your visualization.
- Design the Visualization: Pay careful attention to the design elements of your visualization. Choose appropriate colors, labels, titles, and fonts. The design should be intuitive and visually appealing while focusing on clarity and avoiding clutter. Highlight key points and relationships that align with your objectives.
- Create and Refine the Visualization: Utilize tools such as data visualization software, programming libraries, or even manual design to create the visualization. Once created, review and refine the visualization. Ensure that it effectively conveys the intended message, is easy to understand, and adheres to best practices.
Data Visualization Techniques
Several techniques enhance the effectiveness of data visualization:
- Color Coding: Proper use of colors can highlight patterns, relationships, and differences. However, excessive or inappropriate use can confuse the viewer.
- Interactivity: Interactive visualizations allow users to explore data on their terms, revealing insights at their own pace.
- Animations: Animations can show changes over time, aiding in understanding dynamic processes.
- Storytelling: Crafting a narrative around the visualization guides viewers through the data, making it more engaging.
- Hierarchy and Layout: Arrange visual elements strategically to emphasize important information and guide the viewer's focus.
- Data Aggregation: Summarizing large datasets into smaller groups or categories can simplify complex information.
Elements of Data Visualization
A well-designed data visualization comprises various essential elements:
- Title: Clearly states the purpose of the visualization.
- Axes and Labels: Clearly labeled axes and data points are crucial for proper interpretation.
- Legend: Explains the meaning of colors, symbols, or patterns used in the visualization.
- Data Points: Individual values or data markers that represent the information being displayed.
- Grid Lines: Assist in reading values and understanding the scale of the visualization.
- Scale: Indicates the range and intervals of values on the axes.
- Annotations: Explanatory notes, callouts, or additional information that provide context.
- Source: Cites the origin of the data, promoting transparency and credibility.
Conclusion
In conclusion, data visualization is an essential tool for transforming complex data into understandable and actionable insights. Through various techniques, thoughtful design, and appropriate choice of visualizations, data visualization empowers individuals and organizations to make informed decisions based on a deeper understanding of their data. Whether it's uncovering trends, identifying patterns, or communicating information effectively, data visualization plays a pivotal role in modern data analysis.