No Code Data Visualization
What is no code data visualization? how do you visualize data without coding

What is no code data visualization?
No code data visualization enables you to create engaging charts, graphics, and dashboards without writing any code. It works by using a drag-and-drop user interface to create a cutting-edge visualization that is simple to use.
Coding is not required for data visualization and analysis. Data analysis necessitates the examination of data and the drawing of conclusions. To easily create interactive data visualization, you don't need to write any code. In this article, we will show you the best no-code tool that is simple to use, has a great graphic design, is interactive, and has additional features to make your visualization more presentable.
Data visualization does not necessarily require coding knowledge. Dashboard Builder is the best tool for creating beautiful data visualization with no coding required.
How do you visualize data without coding?
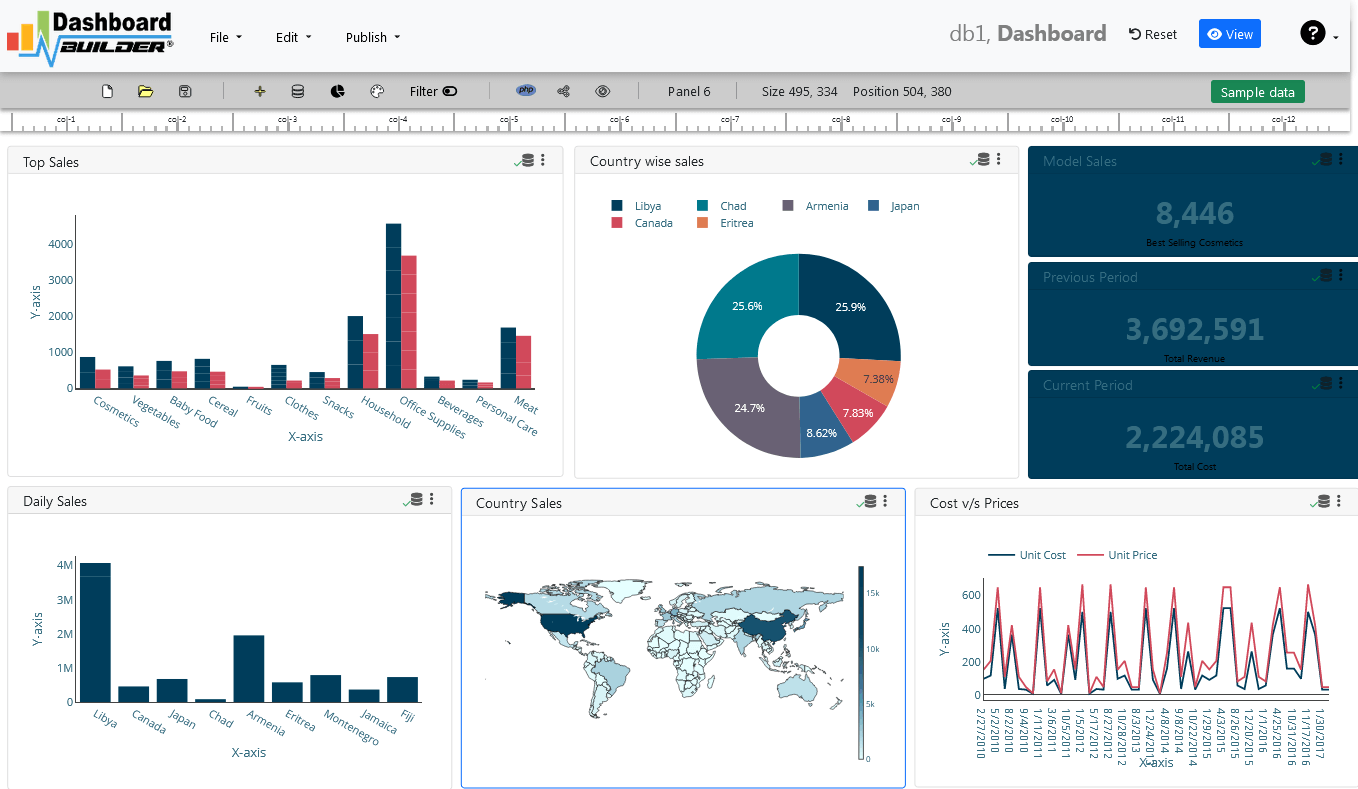
No-code data visualization, as opposed to traditional computer programming, allows programmers and non-programmers to visualize data using drag-and-drop graphical user interfaces and setup.
We'll show you how to use the dashboard builder's no-code feature to visualize data without writing any code in this post. Visualizing completely unique data has traditionally required the services of one or more experienced software engineers. However, as the no-code landscape evolves, makers all over the world are finding it easier than ever to visualize their own complex data, chart, and graph.
Dashboards can take various forms depending on the data displayed and the end use case. With features such as design flexibility, data visualization, and integration, the Dashboard Builder is the ideal visualization tool for supporting the changing requirements of a bespoke dashboard. This guide provides important advice and resources to consider as you begin building your app, whether you're attempting to create a highly visible tool for your internal team or are just getting started with the Dashboard Builder.
No Code Data Visualization Tutorial
Learn how to visualize data with no code and generate source code for interactive and dynamic graphs
APPLIES TO: On-premises Online Desktop
In this article, we'll use the Dashboard Builder Tool to create a chart and retrieve data from a MySQL database, as well as generate source code.
Requirements
- PHP Version 7.2 or later
- Apache 2 or later
- Windows 7 or later /Linux 3 or later
- Firefox 52, Chrome 57, IE 8
Installation
- Download from Download Dashboard Builder
- Place the file in a directory on the web server. e.g.
…/www/dashboar/dbuilder/ - Unzip
 the file using Extract Here option to the root folder of "dashboardbuilder"
STEP-1: Launch the Data Visualization tool
- Access the web folder in your browser. e.g. http://localhost/dashboardbuilder following welcome screen will appear
STEP-2: Access the data
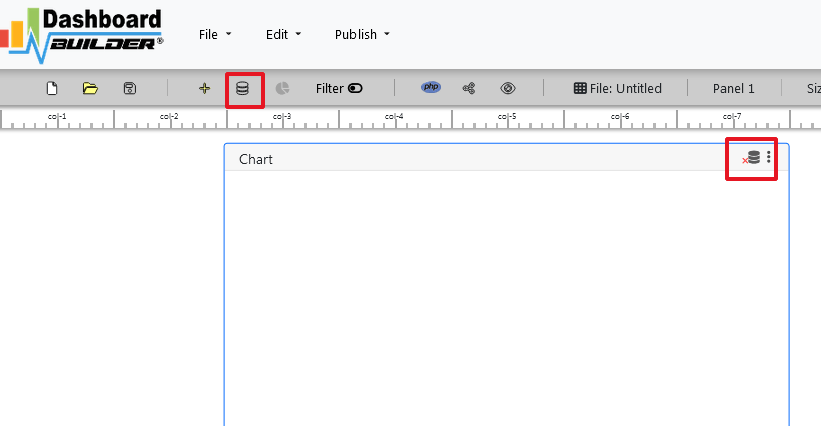
- Now Click the Database icon
- Following screen will appear. Select Database from data source tab. Select MySQL from the list of Database, Enter your
"Northwind.db"in the DB name field and Save changes as mentioned in the screen.
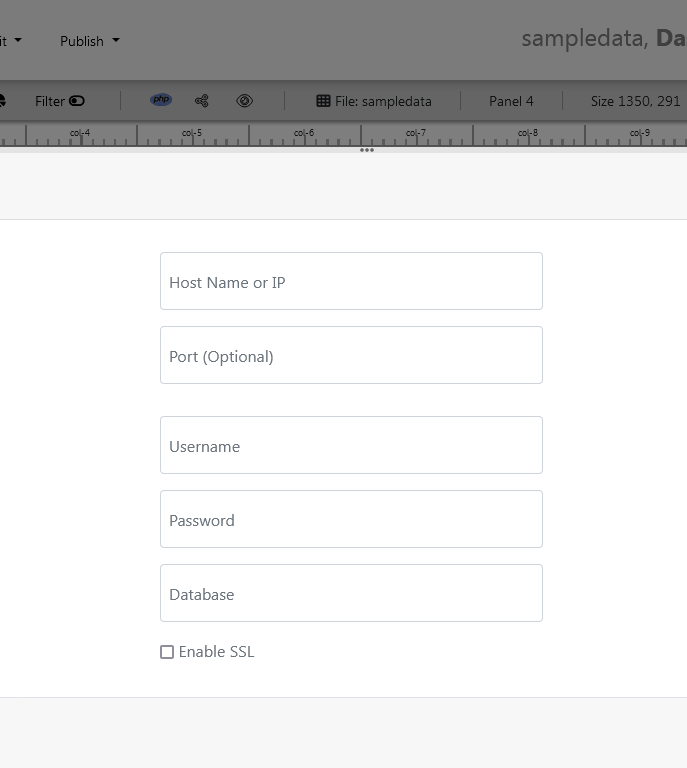
- Enter user name and password of your database.
- A green tick mark with Database will appear when your database is successfully connected.
STEP-3: Assign data
- Select the gear icon for your Dashboard preference.
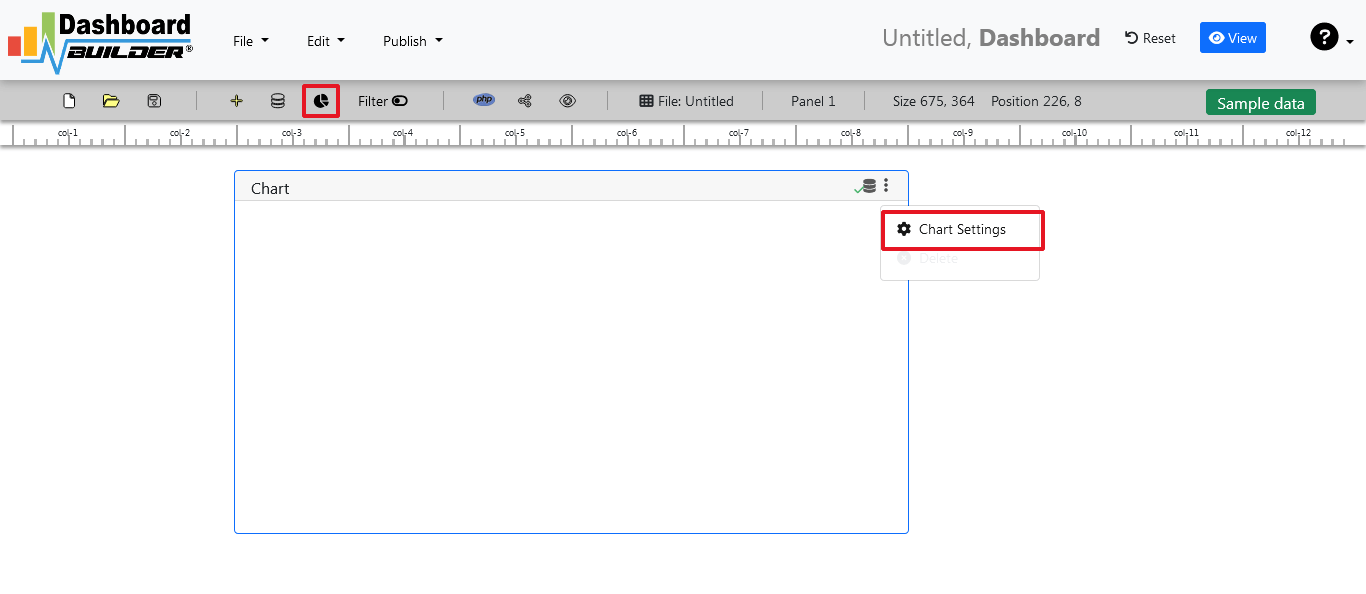
- The following screen with a list of tables will appear.

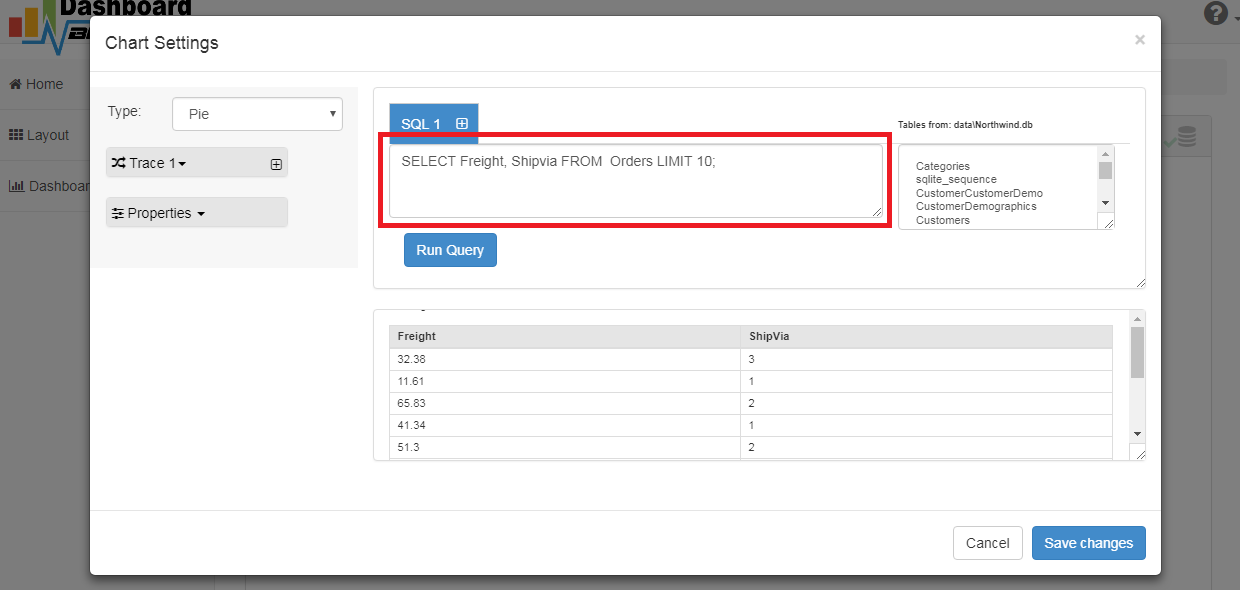
- Enter your SQL statement in text box,
SELECT strftime('%Y-%m',o.shippeddate) as xaxis, sum(d.quantity) as yaxis from `order details` d, orders o where o.orderid = d.orderid group by strftime('%Y-%m',o.orderdate) limit 50
- Click the Run Query button
STEP-4: Select the row and column
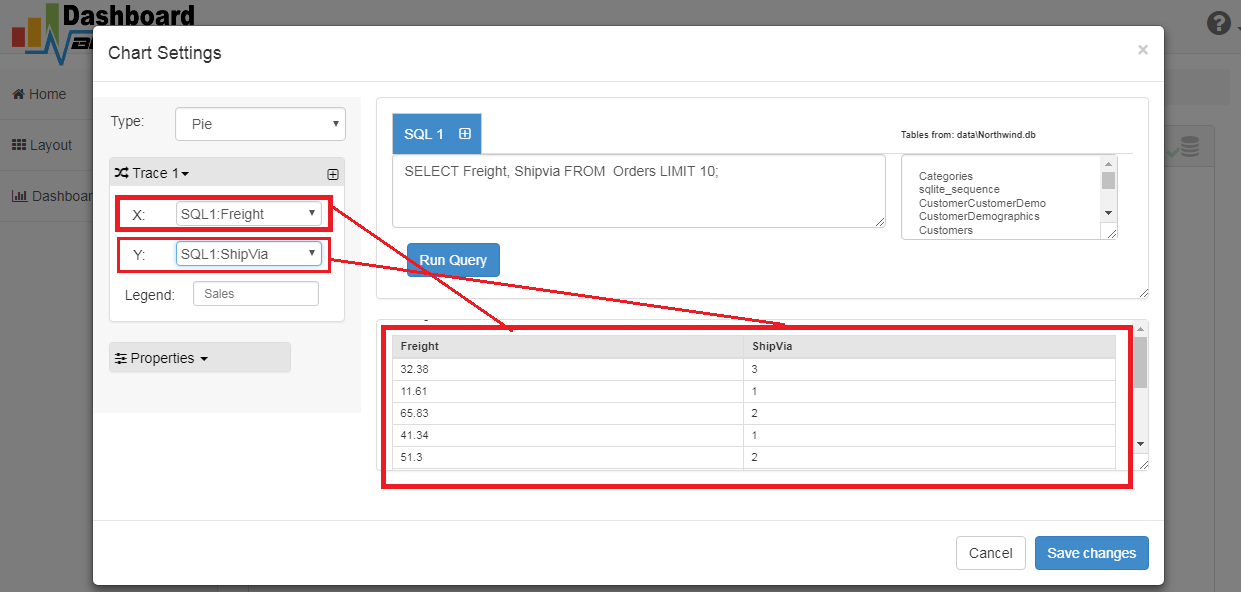
- Query Result will appear. Now Select your x-axis data from the drop down list of X and y-axis data from the drop down list of Y .
- Select Pie from the drop down list of Chart Type
- Click Save Changes
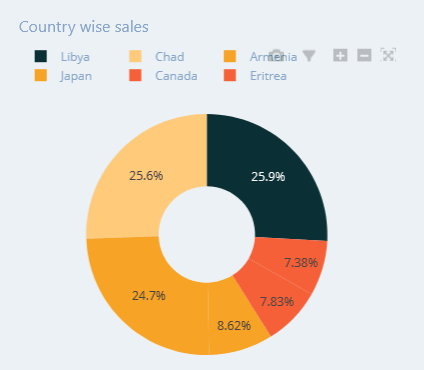
- Charts will be shown on the screen as below.
STEP-5: Generate the source code
- Now extend the Generate button and click on the Create PHP Code

- The chart's code will be created automatically, and you may copy and paste it into your PHP application.
Data Visualization's source code
/**
 * DashboardBuilder
 *
 * @author Diginix Technologies www.diginixtech.com
 * Support  - http://www.dashboardbuilder.net
 * @copyright (C) 2018 Dashboardbuilder.net
 * @version 2.1.7
 * @license: license.txt
 */

include("inc/dashboard_dist.php");  // copy this file to inc folder


// for chart #1
$data = new dashboardbuilder();
$data->type =  "pie";

$data->source =  "Database";
$data->rdbms =  "mysql";
$data->servername =  "";
$data->username =  "";
$data->password =  "";
$data->dbname =  "northwind";
$data->xaxisSQL[0]=  "SELECT strftime(^%Y-%m^,o.shippeddate) as xaxis, sum(d.quantity) as yaxis from `order details` d, orders o  where o.orderid = d.orderid group by strftime(^%Y-%m^,o.orderdate) limit 50";
$data->xaxisCol[0]=  "xaxis";
$data->yaxisSQL[0]=  "SELECT strftime(^%Y-%m^,o.shippeddate) as xaxis, sum(d.quantity) as yaxis from `order details` d, orders o  where o.orderid = d.orderid group by strftime(^%Y-%m^,o.orderdate) limit 50";
$data->yaxisCol[0]=  "yaxis";
$data->name = "piechart";
$data->title = "Pie Chart";
$data->orientation = "";
$data->xaxistitle = "x-axis title";
$data->yaxistitle = "y-axis title";
$result[0] = $data->result();

?>

<!DOCTYPE html>
<html>
<head>
	<script src="assets/js/dashboard.min.js"></script> <!-- copy this file to assets/js folder -->
	<!--<link rel="stylesheet" href="assets/css/bootstrap.min.css"> Bootstrap CSS file, change the path accordingly -->


</head>
<body>

<div class="container">
<div class="col-lg-12">
<div class="panel panel-default">
<div class="panel-heading"></div>
    <div class="panel-body">
        <?php echo $result[0];?>
    </div>
</div>
</div>
</div>
</body>
Sample data visualization
Whether you're looking for inspiration or just want to take a quick look at your clients, a pre-made sample page can get your project started. Visualizing data and graphs in web applications has never been easier.
Conclusion
You've learned how to visualize data with no code application, , and customize it's look and feel using the dashboard builder. Before we go, we'd like to introduce you to the premium version of Dashboard Builder, which has many features compared to the free version.
 the file using Extract Here option to the root folder of "dashboardbuilder"