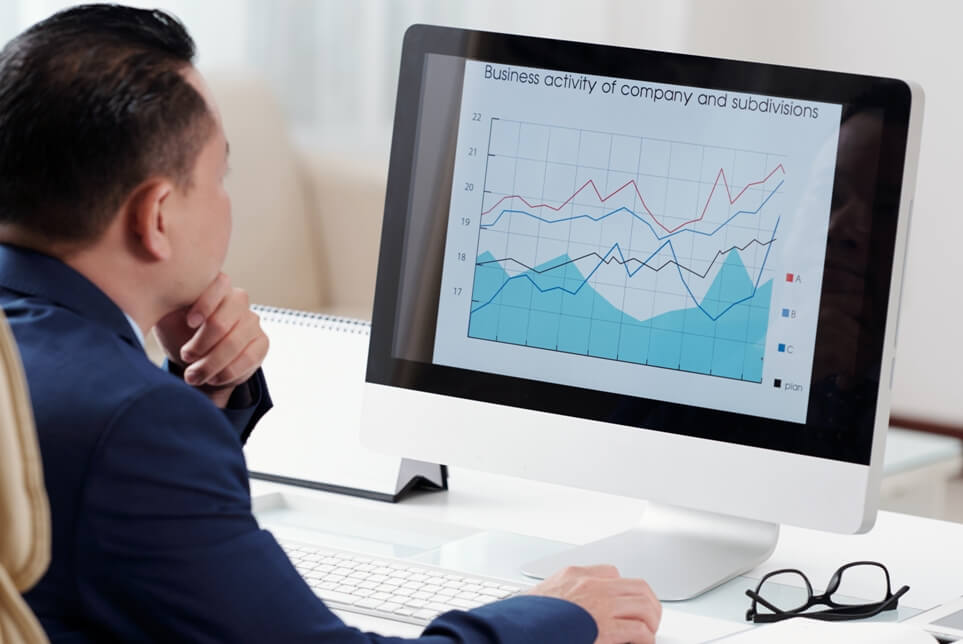
Prediction Analytics in Visualization: A Comprehensive Guide for Data-Driven Decision Making
Overview
Prediction analytics in visualization is a powerful approach that combines predictive analytics techniques with data visualization to gain valuable insights from complex datasets and forecast future trends. In today's data-driven world, businesses and organizations are constantly seeking ways to extract meaningful information from the vast amount of data at their disposal. Prediction analytics in visualization plays a crucial role in helping them transform raw data into actionable intelligence, enabling data-driven decision-making and strategic planning.

Introduction
In today's era of data abundance, organizations are sitting on a goldmine of information. However, the real challenge lies in transforming this raw data into actionable insights to make informed decisions. Prediction analytics in visualization is a powerful combination that enables businesses to unlock the hidden potential of their data and predict future trends. In this guide, we will explore the concepts of prediction analytics in visualization and provide a step-by-step approach on how to effectively use it for data-driven decision making.
I. Understanding Prediction Analytics in Visualization
Prediction analytics, also known as predictive analytics, is the use of statistical algorithms and machine learning techniques to analyze historical data and make predictions about future events. It involves identifying patterns, relationships, and trends within data to forecast outcomes. Visualization, on the other hand, employs charts, graphs, and interactive dashboards to represent complex data visually. Combining prediction analytics with visualization enhances the comprehension of analytical results and aids in decision-making processes.
II. The Benefits of Prediction Analytics in Visualization
- Clear Insights: Visualization makes complex data more accessible and understandable, allowing decision-makers to quickly grasp key insights without getting lost in technical jargon.
- Proactive Decision Making: Predictive analytics empowers businesses to anticipate future trends, identify potential risks, and take proactive measures to stay ahead of the competition.
- Optimal Resource Allocation: Visualization of predictive models enables efficient allocation of resources, optimizing budget allocation, workforce planning, and inventory management.
- Personalization and Customer Engagement: By predicting customer behavior and preferences, businesses can tailor their products and services to meet individual needs, enhancing customer engagement and loyalty.
III. How to Use Prediction Analytics in Visualization
Step 1: Define the Objective
- Clearly articulate the problem or question you want to answer using prediction analytics. Whether it's forecasting sales, predicting customer churn, or optimizing inventory, a well-defined objective is crucial.
Step 2: Data Collection and Preparation
- Gather relevant data from various sources and ensure its quality, accuracy, and completeness.
- Preprocess the data by handling missing values, normalizing or scaling, and converting it into a format suitable for analysis.
Step 3: Choose the Right Model
- Select appropriate predictive algorithms based on your specific use case. Predictive modeling involves giving the presence of particular variables in a large dataset a certain weight or score. This score is then used to calculate the probability of a certain event occurring in the future. For this reason, the dashboard builder uses regression modeling approaches in predictive analytics.
Step 4: Model Training and Validation
- Split your data into training and validation sets to train the predictive model and test its accuracy.
- Use techniques like cross-validation to ensure the model's reliability and prevent overfitting.
Step 5: Apply Visualization Techniques
- Utilize data visualization tools like the Dashboard Builder to present the results of your predictive model in a visually compelling manner.
- Create interactive dashboards, charts, and graphs to display trends and insights that support your decision-making process.
Step 6: Interpretation and Decision Making
- Interpret the visualizations carefully, considering the implications of the predictions on your business objectives.
- Use these insights to make well-informed decisions and develop strategies to capitalize on opportunities and mitigate risks.
Step 7: Monitor and Refine
- Continuously monitor the performance of your predictive model and update it as new data becomes available.
- Refine your visualization techniques based on feedback and changing business needs.
IV. Best Practices and Challenges
Best Practices:
- Ensure data quality and integrity throughout the entire process to obtain accurate predictions..
- Collaborate with domain experts to understand the nuances of the business problem and validate model outputs..
- Keep visualizations simple, intuitive, and relevant to the audience..
Challenges:
- Dealing with large and complex datasets that may require powerful computing resources.
- Addressing potential biases in the data and models to ensure fair and ethical predictions.
- Managing data security and privacy concerns, especially when dealing with sensitive information.
Conclusion
Prediction analytics in visualization empowers you to make data-driven decisions, gaining valuable insights into future trends and outcomes. By following the step-by-step guide outlined in this article, you can harness the power of predictive models and data visualization tools to unlock the true potential of their data. It's crucial to remember that successful implementation requires a combination of technical expertise, domain knowledge, and a commitment to continuous improvement. Embrace prediction analytics in visualization as a strategic asset that guides your business toward growth and success in an increasingly competitive landscape.