Maximizing the Potential of Data Visualization Software: A Comprehensive Guide
In today's data-driven business landscape, the ability to transform raw data into actionable insights is paramount. This is where data visualization software comes into play, making complex data more accessible and understandable. One such robust data visualization software that excels in the world of data visualization is Dashboard Builder. In this article, we'll explore how Dashboard Builder and other data visualization software solutions help businesses effectively harness the power of data through visualization.

What is Data Visualization Software?
Data Visualization Software is a powerful tool that helps businesses make sense of their data. It provides an intuitive and user-friendly platform for transforming complex datasets into visually appealing and informative dashboards. These dashboards can include a wide range of charts, graphs, and visual elements that facilitate data-driven decision-making.
Key Benefits of Data Visualization Software:
- User-Friendly Interface: One of the standout features of Data Visualization Software is its user-friendly interface. Even users with limited technical expertise can create stunning visualizations and dashboards without the need for extensive training. This accessibility is essential for ensuring that data insights are available to a wide range of team members, not just data scientists or analysts.
- Customization: Data Visualization Software offers a high degree of customization. Users can tailor their visualizations to match their specific business needs and branding. This means you can create dashboards that are not only informative but also visually appealing and aligned with your company's identity.
- Integration with Multiple Data Sources: To make informed decisions, businesses often need to consolidate data from various sources. Data Visualization Software streamlines this process by integrating with multiple data sources, allowing users to connect data from databases, spreadsheets, cloud services, and more. This ensures that your visualizations are always based on the latest and most relevant data.
- Real-Time Data Updates:In today's fast-paced business world, timely information is crucial. Data Visualization Software can provide real-time updates, ensuring that your visualizations reflect the most current data. This feature is particularly valuable for businesses where quick decision-making is essential.
- Collaboration and Sharing: Effective data-driven decision-making often involves collaboration among team members. Data Visualization Software supports collaboration by allowing users to share dashboards with colleagues, clients, or stakeholders. This facilitates discussions and ensures everyone is on the same page when it comes to interpreting the data.
- Interactive Dashboards: The interactive capabilities of Data Visualization Software enable users to drill down into data, filter information, and explore different aspects of the dataset. This level of interactivity can uncover hidden insights and provide a more comprehensive understanding of the data.
- Support for Various Visualization Types: : Data Visualization Software offers a variety of chart types, such as bar charts, pie charts, line graphs, scatter plots, and more. This versatility allows users to select the most suitable visualization method for their data, enhancing the effectiveness of communication.
Use Cases for Data Visualization Software:
Data Visualization Software can be applied to various business scenarios, including:
- Sales Analysis: Visualizing sales data to identify trends, monitor performance, and optimize sales strategies..
- Marketing Insights: Creating dashboards to track the effectiveness of marketing campaigns, customer engagement, and ROI.
- Financial Reporting: Generating financial dashboards to monitor revenue, expenses, and overall financial health.
- Project Management: Using visualizations to track project progress, identify bottlenecks, and allocate resources efficiently.
- Data Monitoring: Real-time monitoring of key performance indicators (KPIs) and data quality.
Extending the Benefits of Dashboard Builder as Data Visualization Software:
Extending the benefits of Dashboard Builder as a data visualization software unveils its advanced capabilities in data integration, transformation, and predictive analytics.

Dashboard Builder as a data visualization software excels at seamlessly connecting to diverse data sources, enabling comprehensive views of an organization's performance. With advanced data transformation features, users can refine and cleanse data within the software, eliminating the need for external tools. Predictive analytics integration empowers businesses to make proactive decisions by leveraging historical data to forecast future trends. Robust security measures ensure data integrity, while real-time collaboration fosters team discussions and collective insights. Scalability caters to businesses of all sizes, and a template library expedites dashboard creation. Dashboard Builder, thus, transcends basic data visualization to become an indispensable asset for strategic decision-making and operational excellence.
- Multiple Data Source Integration: Dashboard Builder is known for its robust capabilities in integrating with a wide range of data sources. Whether your data resides in spreadsheets, cloud-based applications, databases, or even streaming data, Dashboard Builder can seamlessly connect to these sources. This versatility allows you to consolidate and visualize data from multiple parts of your organization, providing a comprehensive and holistic view of your business's performance.
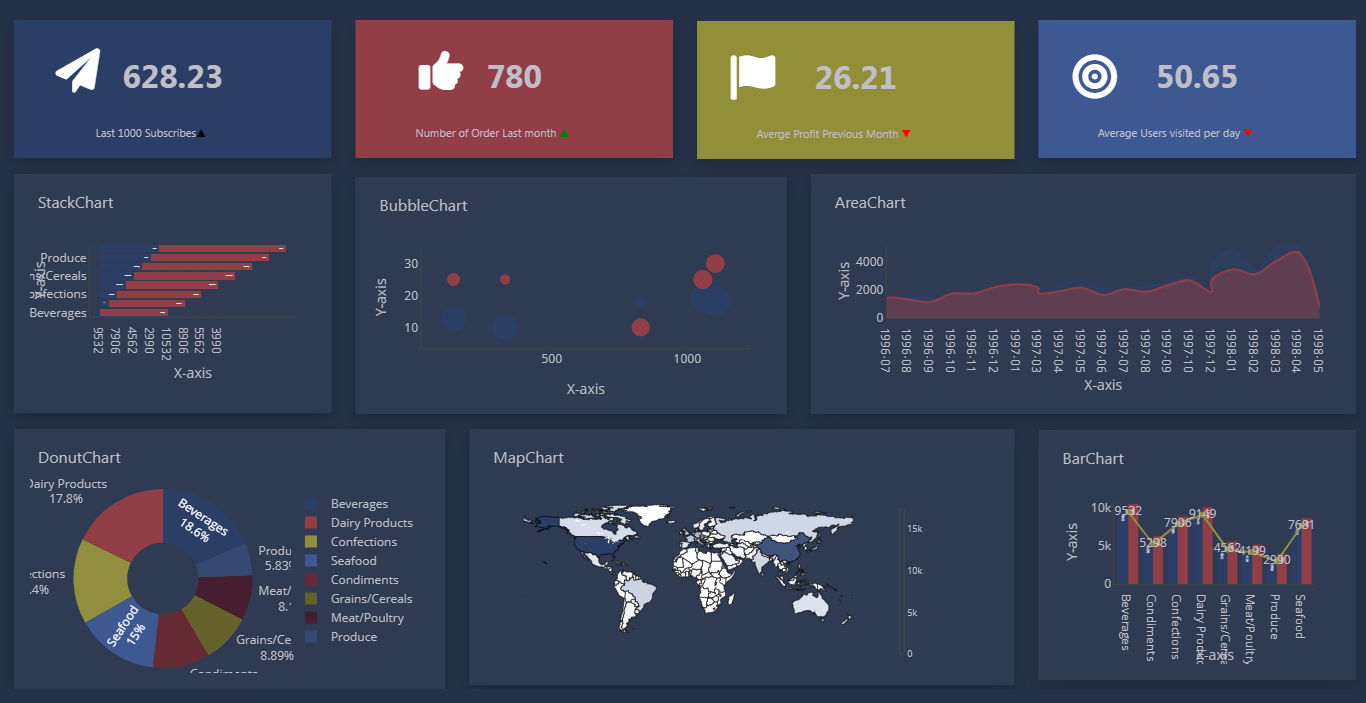
- Bar Chart: Bar charts are used to compare data across categories. They are effective for showing discrete data and highlighting differences between categories.
- Advanced Data Transformation: Beyond simple charting and graphing, Dashboard Builder offers advanced data transformation features. Users can apply data cleansing, filtering, and aggregation to ensure that the data is in the right format for visualization. This means you can perform complex data manipulations within the software itself, reducing the need for external data processing tools.
- Predictive Analytics: Dashboard Builder goes beyond basic data visualization by incorporating predictive analytics capabilities. It allows users to build predictive models and incorporate forecasts directly into their dashboards. This feature is invaluable for businesses seeking to proactively identify trends, patterns, and potential future outcomes based on historical data.
- Security and Permissions: Data security is a paramount concern for businesses. Dashboard Builder provides robust security features, including role-based access control and permissions management. This ensures that sensitive data is only accessible to authorized users, safeguarding critical business information.
- Scalability: Dashboard Builder is highly scalable, making it suitable for businesses of all sizes. Whether you're a small startup or a large enterprise, the software can adapt to your evolving data visualization needs. This scalability ensures that you can continue to leverage the software as your business grows and data complexity increases.
- Real-time Collaboration: Effective collaboration is at the heart of informed decision-making. Dashboard Builder promotes real-time collaboration by allowing multiple users to work on a dashboard simultaneously. This collaborative environment fosters discussions, data interpretation, and collective insights, ensuring that your entire team is aligned in their understanding of the data.
- Extensive Template Library: Dashboard Builder comes equipped with a vast library of pre-designed templates and widgets. These templates cover a wide range of business use cases, from sales and marketing to finance and operations. Users can leverage these templates to expedite the dashboard creation process, saving time and effort.
Use Cases Amplified with Dashboard Builder:
Dashboard Builder enhances a wide spectrum of business use cases, elevating the potential of data visualization in various domains. From business intelligence reporting to data-driven marketing, financial data analysis, and operational efficiency optimization, this powerful software brings data to life and transforms it into actionable insights. Additionally, it is a cornerstone of strategic decision-making, aligning data with overarching business objectives and ensuring that organizations are equipped with the insights needed to thrive in a data-driven world.
- Business Intelligence Reporting: Dashboard Builder is the ideal software for creating comprehensive business intelligence reports. It can pull data from various sources, perform complex calculations, and generate insightful reports. This is particularly useful for executives and decision-makers seeking to monitor key performance indicators and gain a holistic view of their organization.
- Data-driven Marketing: For marketing professionals, Dashboard Builder offers a powerful platform to track campaign performance, customer engagement, and ROI. Real-time analytics enable marketers to adjust strategies on the fly, maximizing the impact of their efforts.
- Financial Data Analysis: Financial departments can leverage Dashboard Builder to visualize financial data, track revenues, expenses, and profitability. Advanced features like predictive analytics assist in forecasting financial trends and identifying potential risks.
- Operational Efficiency: Dashboard Builder is a valuable tool for optimizing operational efficiency. It helps organizations track project progress, identify bottlenecks, and allocate resources more effectively, ensuring projects stay on track and within budget.
- Strategic Decision-making: As a comprehensive data visualization software, Dashboard Builder plays a critical role in strategic decision-making. It allows businesses to translate data into actionable insights, enabling informed and data-driven decisions that align with overarching business goals.
Conclusion: Maximizing the Power of Data Visualization with Dashboard Builder
In the fast-paced world of business, the ability to extract meaningful insights from data is a competitive advantage. Dashboard Builder, as a versatile and feature-rich data visualization software, empowers businesses to leverage their data effectively. It's more than just a tool for creating charts and graphs; it's a robust platform that integrates data sources, transforms data, provides predictive analytics, and fosters collaboration. With Dashboard Builder, organizations can navigate the complex data landscape with ease, enabling data-driven decision-making, optimizing efficiency, and propelling business growth. In a data-driven world, Dashboard Builder is the compass that leads to informed and strategic decisions, ultimately driving success and innovation.