How to Export Data from Charts to CSV: Master Data Export a complete guide
Learn How to View and Export Chart Data to CSV with Dashboard Builder
In the realm of data analysis and visualization, extracting insights from charts and graphs is just the beginning. Often, we need to export this data for further analysis or integration with other tools. Whether you're a seasoned data analyst or a beginner, knowing how to export data from charts to CSV (Comma-Separated Values) files can significantly enhance your workflow. In this guide, we'll walk you through the process step by step using Dashboard Builder, a powerful tool for visualizing and analyzing data.
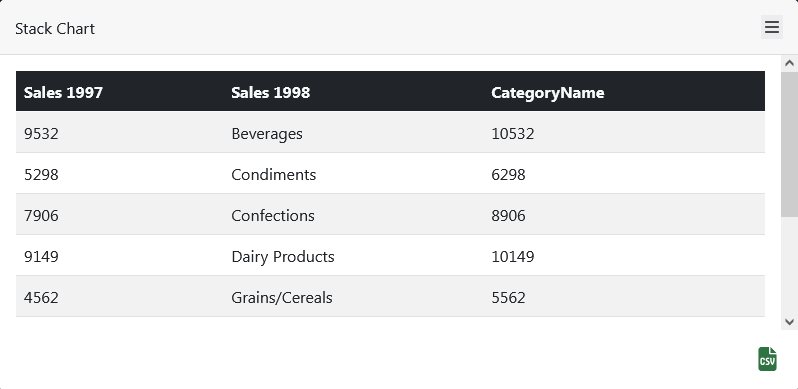
Enable and Disable Option to View Data
Before diving into data export, it's essential to ensure that the option to view and export data is enabled within Dashboard Builder. Here's how to do it:.
- Click on the chart you wish to view and export data from.
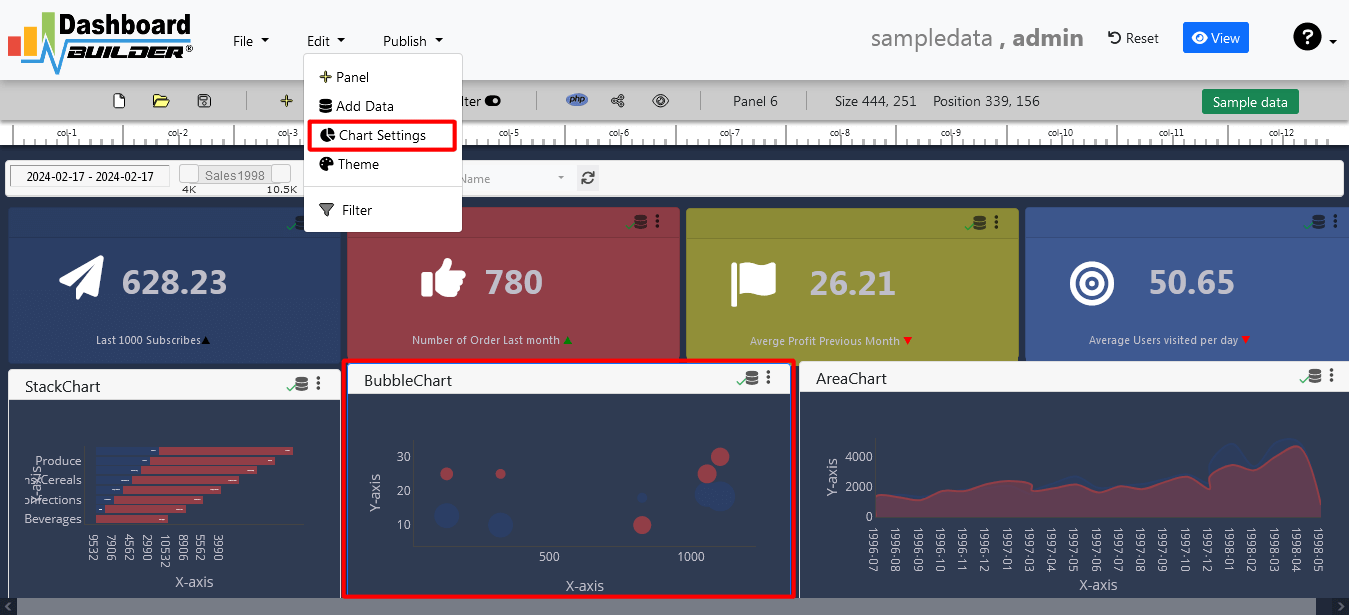
- Click on "Edit" > "Chart Settings" button, or simply double click the top bar of the chart.
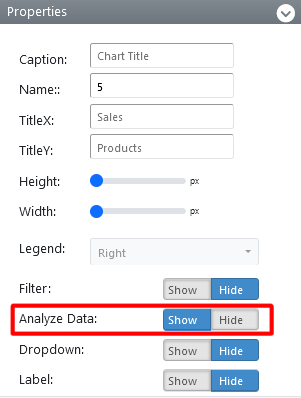
- In the Chart Settings Window, extend the Properties setting panel.
- Select the "Show View Data" option to enable viewing and downloading data.
- If you prefer to restrict access, you can choose the "Hide" option for View Data.
- Save the changes by clicking the "Save Changes" button.
Exporting Data from a Chart
Once the option to view and export data is enabled, exporting data becomes a breeze::
- View the report containing the chart you're interested in.
- Hover over the chart.
- Click on the "View Data" icon.
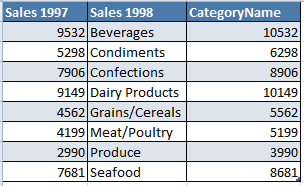
- A popup window will appear displaying the data in a tabular format.
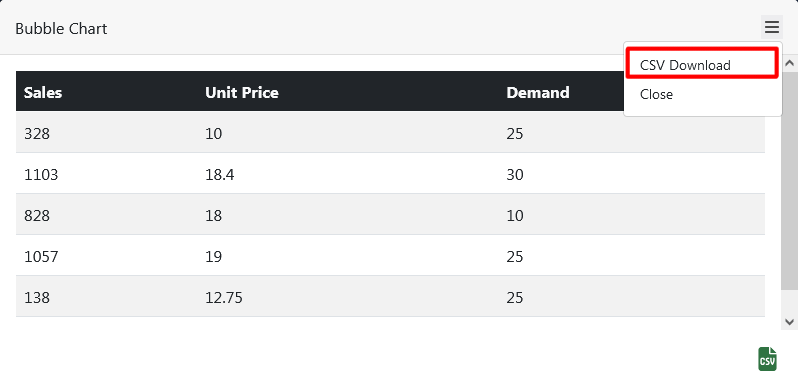
- Access the right-click menu.
- Click on the "CSV Download" button to download the data in CSV format.

Can't See the Menu?
If you're unable to access the menu for exporting data, it's possible that the owner of the report has restricted viewing and exporting data.
Understanding How Data Export Works
Data export functionality in Dashboard Builder is designed to streamline the process of transferring chart data into CSV format. Here's what you need to know:
- Data export saves chart information into CSV files.
- Exporting data is available in view mode, presented in a table format..
- Export functionality operates on an individual chart basis, ensuring that only the data relevant to the selected chart is exported..
- Any filters or date range controls applied to the chart are also reflected in the exported data. This allows for fine-tuning of data before exporting, enhancing accuracy and relevance..
Conclusion
By following these steps, you can effortlessly export data from charts to CSV files using Dashboard Builder. Whether you're conducting in-depth analysis, sharing insights with colleagues, or integrating data with external tools, this feature empowers you to make the most of your data-driven endeavors. Unlock the full potential of your data visualization efforts with seamless data export capabilities..
How helpful was this information?
Related topics
- How to Export Data from Charts to CSV: Master Data Export a complete guide